Introduction
OrganoidDB is an integrated organoid resource of transcriptomic data. We analyzed the raw data through a standard pipeline, and present the data on this user-friendly web application.
Currently, OrganoidDB contains 12,902 and 3,307 human and mouse organoid samples (involving 172 organoid types, e.g. colon, liver, brain), respectively, from GEO and ArrayExpress. Other types of samples, including primary tissues, cell lines, xenografts and patient-derived organoids are also integrated to enable comparisons to be made with organoids. As a result, 1,012 comparison and development datasets are organized, including 104 scRNAseq datasets. The raw data were then cleaned and analyzed through a standard pipeline and the integrated data were presented on our user-friendly web application.
Functions
General
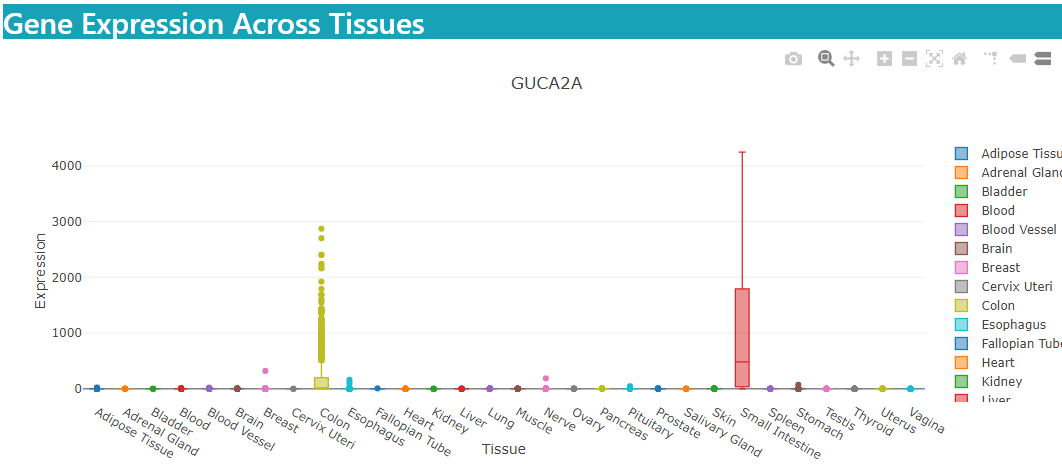
The “general” mode, provides search for an overview of a gene expression across different organoids compared with other types of cell culture and primary tissue.
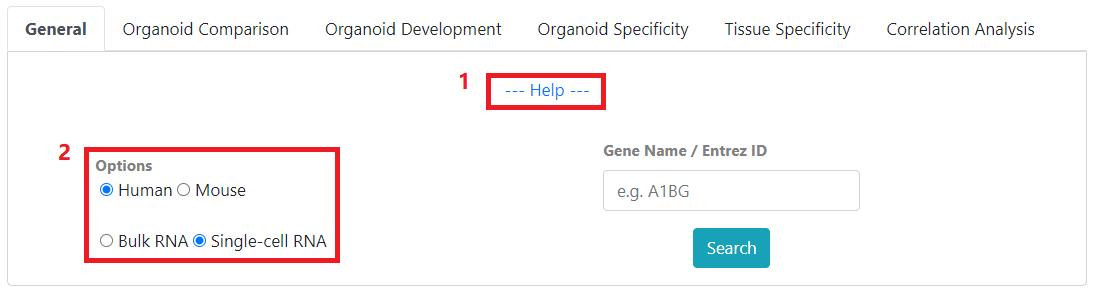
1) The expandable help section under each mode describes the input parameters. 2) Under options, you can choose to search among human and mouse samples as well as bulk RNA and single-cell samples
Parameters
Options: Select between human and mouse samples as well as bulk and single-cell samples.
Gene Name / Entrez ID: Search for expression by gene name or entrez ID, searching by gene name will have an autocomplete feature after entering 2 characters.
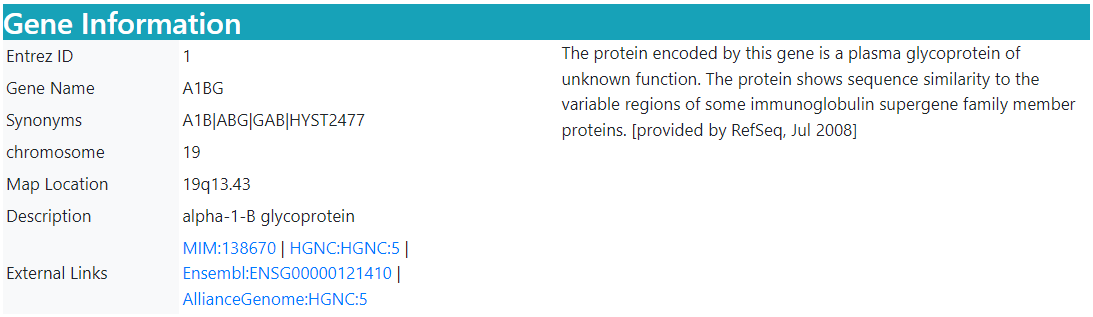
Results
In the results, you can view related gene information for your searched gene
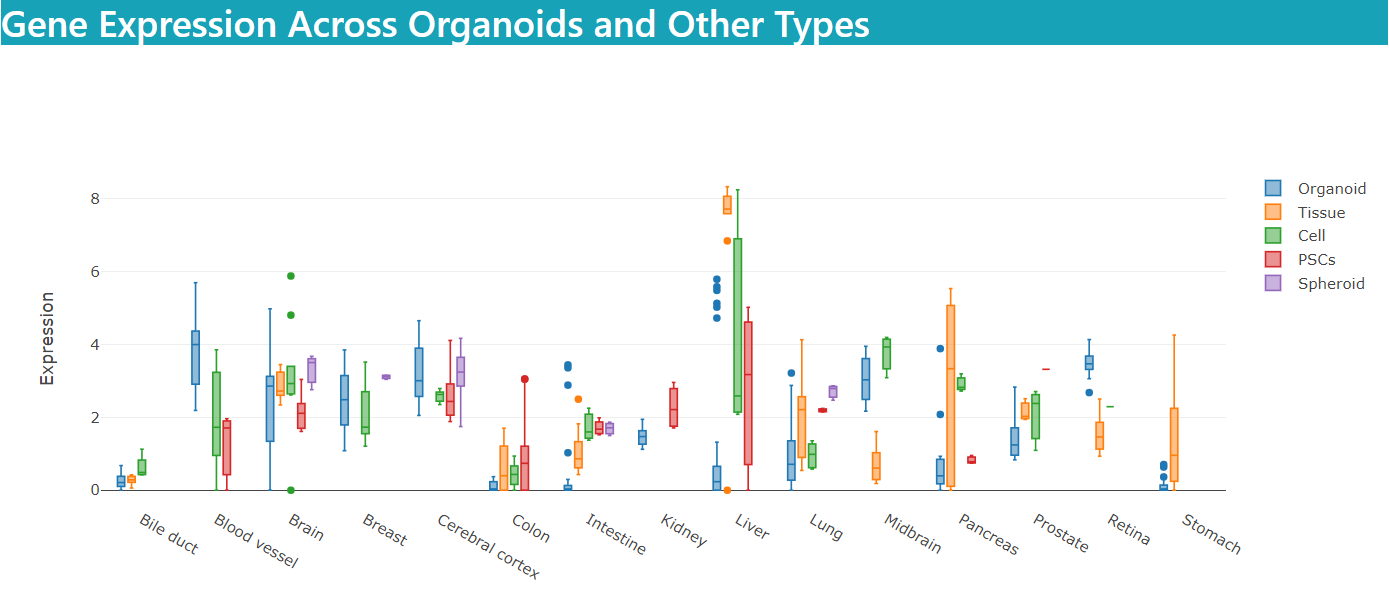
As well as the gene's expression across different organoids compared with other types of cell culture and primary tissue.
Organoid Comparison
“Organoid comparison” mode, shows comparison of gene expressions, pathways and cell type compositions in organoid samples to those in tissue, cell line, xenografts, etc, and compare organoids from different derivation sources or different protocols.
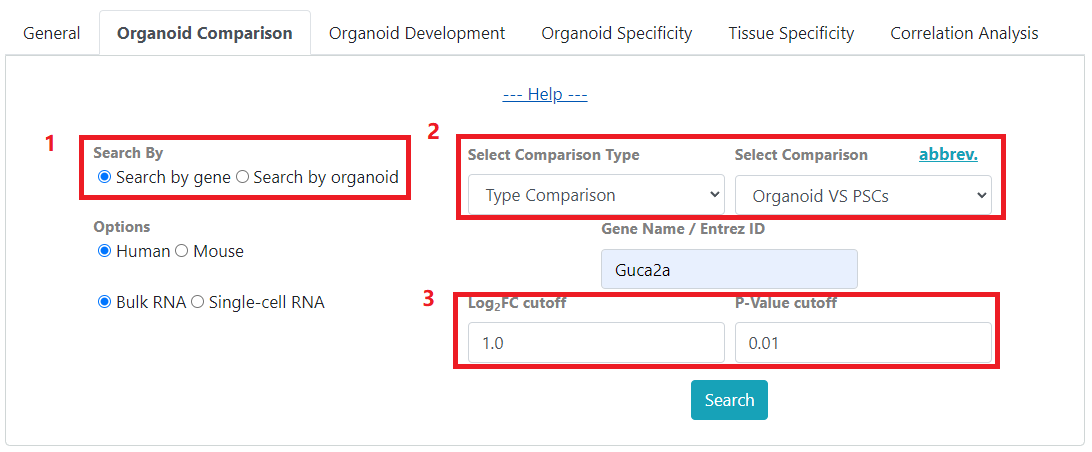
In comparison search, you can choose to 1) search by gene or search by organoid. When searching by gene, you will be able to 2) select a comparison type and its related comparison data sets to display. And 3) filter your search by fold change and P-value.
Parameters
Search By: Select to search by gene or search by organoid type.
Options: Select between human and mouse samples as well as bulk and single-cell samples.
Select Comparison Type: Query the selected comparison type.
Select Comparison: Query the selected comparison. Click abbrev. for list of comparison abbreviations.
Gene Name / Entrez ID: Search for expression by gene name or entrez ID, searching by gene name will have an autocomplete feature after entering 2 characters.
Select Organoid: When Search by organoid is selected, choose an organoid type.
Log2FC cutoff: Results will have fold-change greater than user defined threshold.
P-value cutoff: Results will have P-values less than user defined threshold.
Note: Only top 50,000 results sorted by P-value are shown.
Results
As show in picture below, in the search results, you can 1) download the table of differentially expressed genes in the comparison. 2) sort the table by clicking on the column headers, e.g. sort by fold change. 3) See more detailed information about the related study by clicking on the Dataset ID link. 4) get a quick view of the expression box plot.
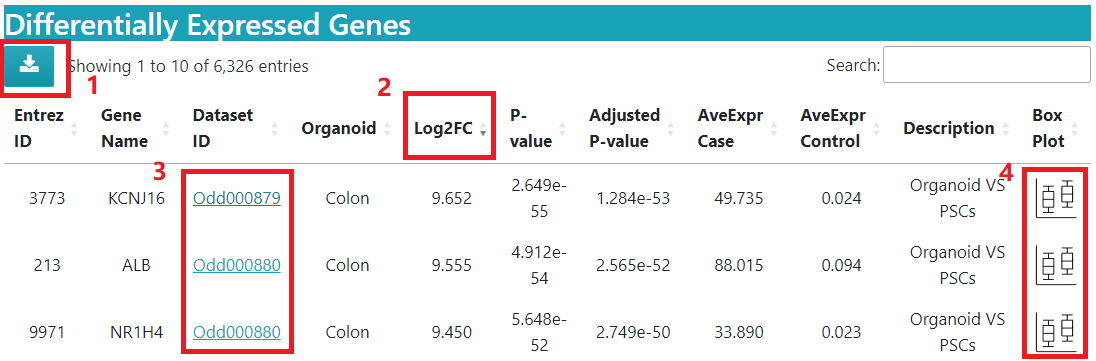
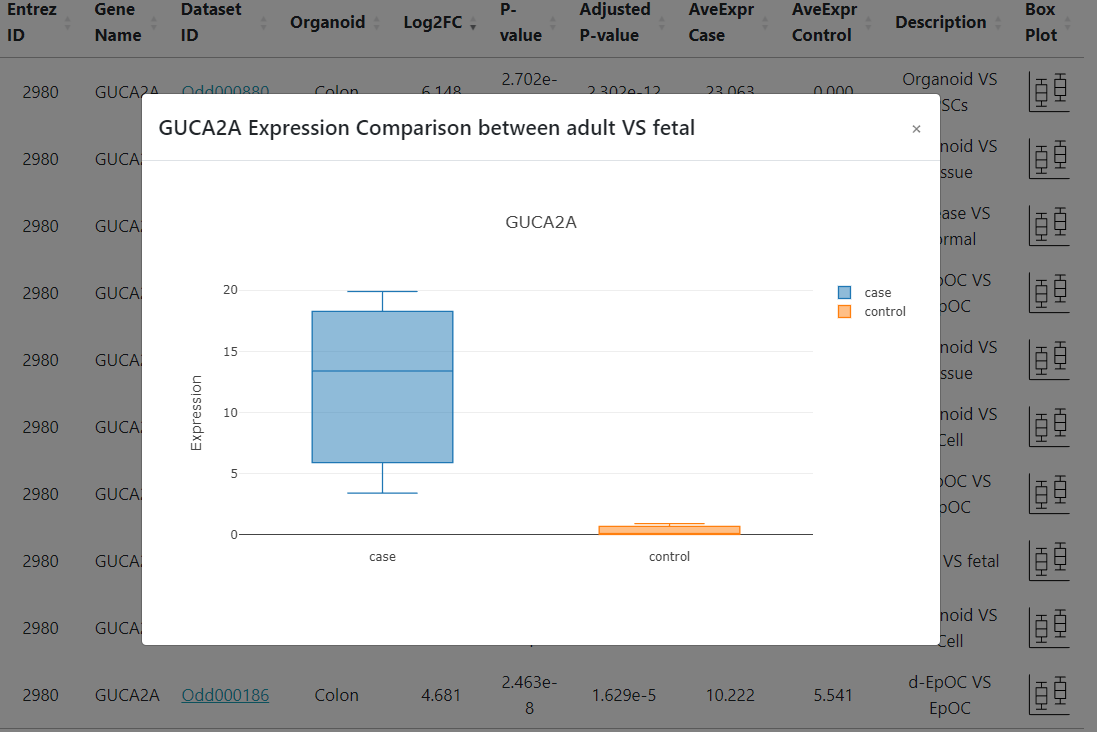
Clicking on 4) boxplot icons will display the expression comparison as shown below.
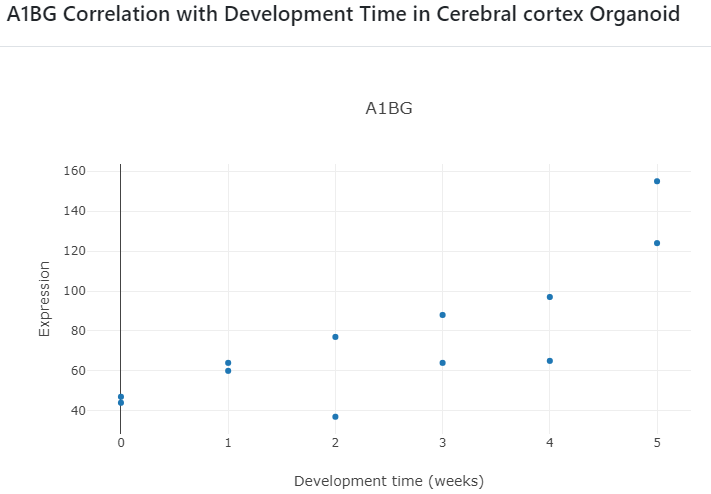
Organoid Development
“Organoid development” mode, allows finding of development-correlated genes by calculating correlation of gene expression as organoid cultures develop over time.
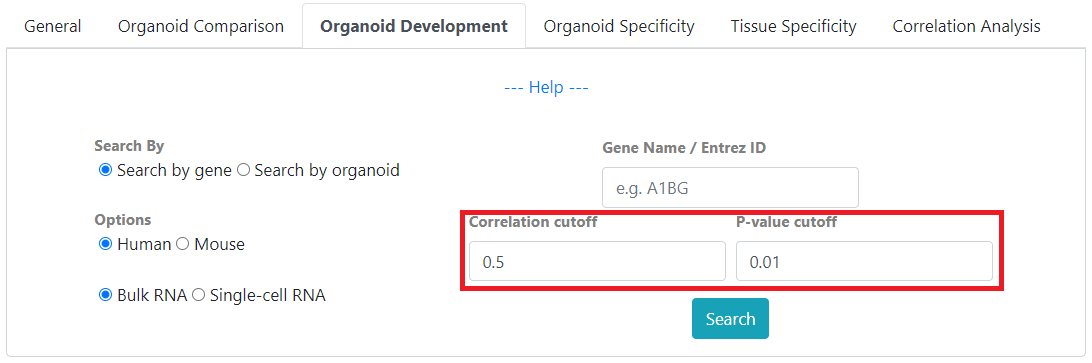
For development searches, you can filter results by gene expression correlation with development time and P-value.
Parameters
Search By: Select to search by gene or search by organoid type.
Options: Select between human and mouse samples as well as bulk and single-cell samples.
Gene Name / Entrez ID: Search for expression by gene name or entrez ID, searching by gene name will have an autocomplete feature after entering 2 characters.
Select Organoid: When Search by organoid is selected, choose an organoid type.
Correlation cutoff: Results will have absolute value of Spearman's correlation greater than user defined threshold.
P-value cutoff: Results will have P-values less than user defined threshold.
Note: Only top 50,000 results sorted by P-value are shown.
Results
The search results will show a list of available development studies and the searched gene's correlation with the organoid's culture duration.
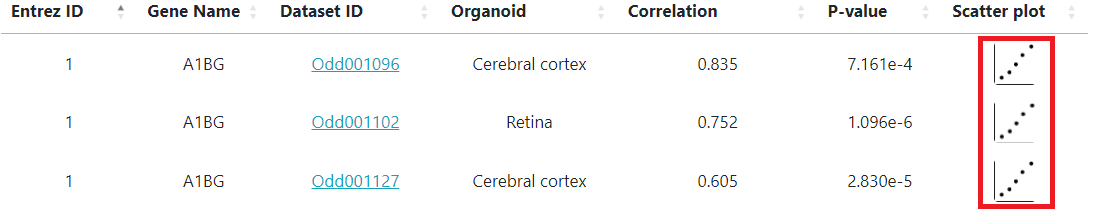
Clicking on the scatter plot icons (marked inside the red box above) will display the correlation scatter plots as shown below.
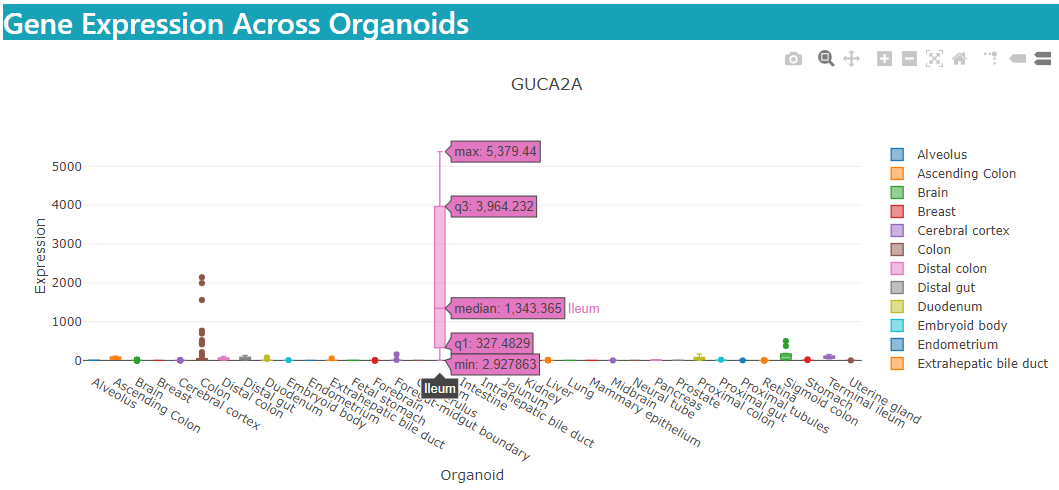
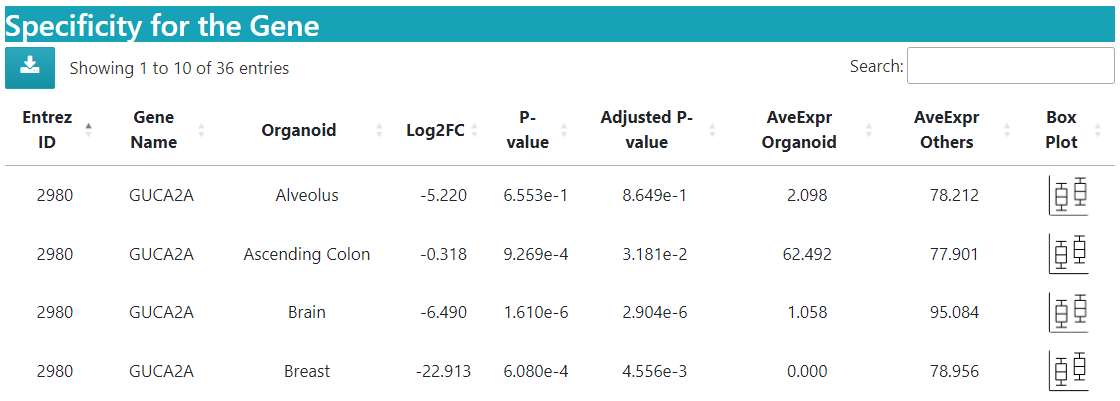
Organoid Specificity
This mode will help identification of organoid specific genes in various organoid types. Organoid specificity was measured through comparison between the given organoid type and the remaining organoid types using differential expression analysis. Fold change and P-value were used to estimate the organoid specificity.
Parameters
Search By: Select to search by gene or search by organoid type.
Options: Select between human and mouse samples as well as bulk and single-cell samples.
Gene Name / Entrez ID: Search for expression by gene name or entrez ID, searching by gene name will have an autocomplete feature after entering 2 characters.
Select Organoid: When Search by organoid is selected, choose an organoid type.
Log2FC cutoff: Results will have fold-change greater than user defined threshold.
P-value cutoff: Results will have P-values less than user defined threshold.
Results
For bulk samples, expression boxplots are plotted across various organoid types.
Expression details are displayed in a specificity table as shown below.
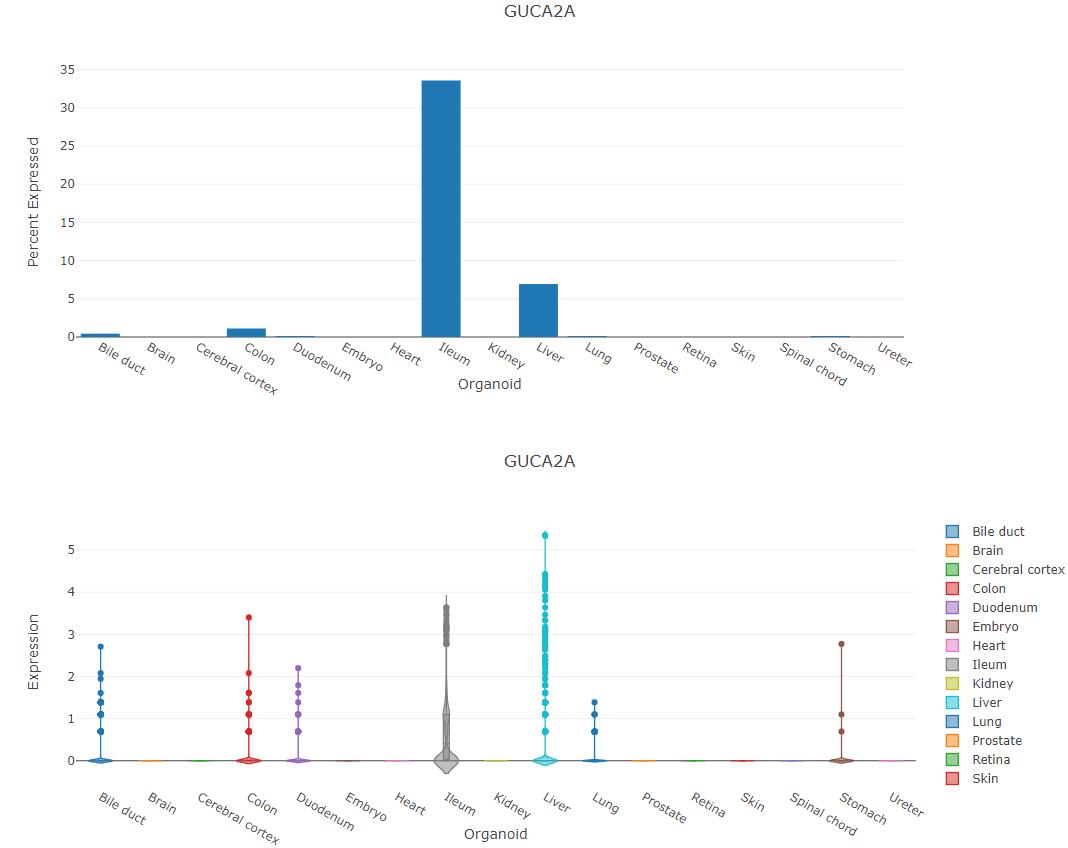
For single-cell samples, plot for percent of cells the searched gene is expressed in is shown along side its expression violin plot.
Tissue Specificity
This mode will help identification of tissue specific genes in various tissue types. Tissue specificity was measured through comparison between the given tissue type and the remaining tissue types using differential expression analysis. Fold change and P-value were used to estimate the tissue specificity.
Parameters
Search By: Select to search by gene or search by tissue type.
Options: Select between human and mouse samples as well as bulk and single-cell samples.
Gene Name / Entrez ID: Search for expression by gene name or entrez ID, searching by gene name will have an autocomplete feature after entering 2 characters.
Select Tissue: When Search by tissue is selected, choose a tissue type.
Log2FC cutoff: Results will have fold-change greater than user defined threshold.
P-value cutoff: Results will have P-values less than user defined threshold.
Results
Results are displayed in the same fashion as in Organoid Specificity. Users can use this mode as a reference to see if genes specific to organoids are also specific to their corresponding tissue types.
Correlation Analysis
“Correlation analysis”, study gene-gene correlation across organoids or tissues.
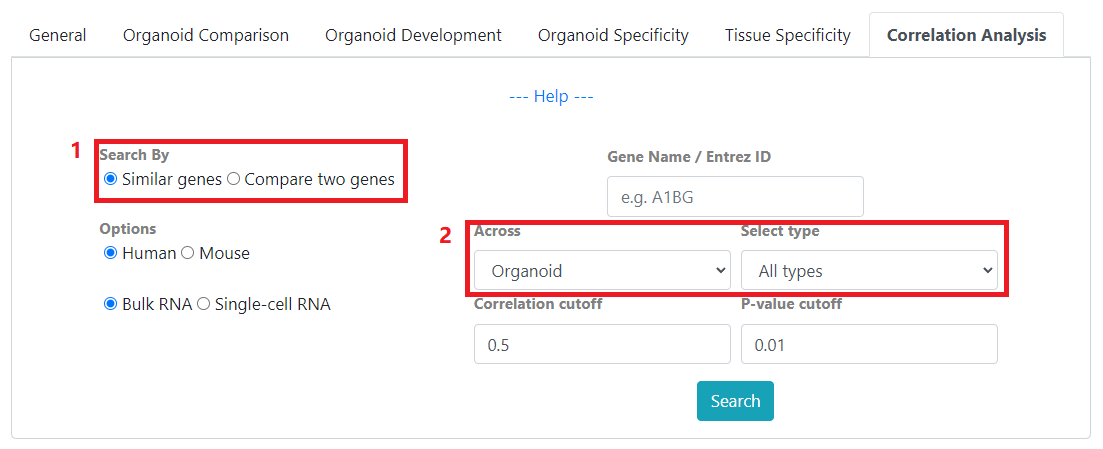
In correlation search, you can 1) search for similar genes or compare two genes. In both modes, you can 2) select to see correlation of your genes of interest across organoid samples as well as tissue samples
Parameters
Search By: Select to search by similar genes or compare two genes.
Options: Select between human and mouse samples as well as bulk and single-cell samples.
Gene Name / Entrez ID: Search for expression by gene name or entrez ID, searching by gene name will have an autocomplete feature after entering 2 characters.
Compare with: When Compare two genes is selected, enter an additional gene name or entrez ID to see correlation with the first gene.
Across: See correlations across organoid or tissue types. When Organoid is selected, gene-gene correlation are calculated from the Organoid Specificity dataset. When Tissue is selected, gene-gene correlations are calculated from the Tissue Specificity dataset.
Select type: Correlations results are filtered by either organoid or tissue type depending on the selected Across option.
Correlation cutoff: Results will have absolute value of Spearman's correlation greater than user defined threshold.
P-value cutoff: Results will have P-values less than user defined threshold.
Results
Correlation details for searched genes are displayed in a datatable.
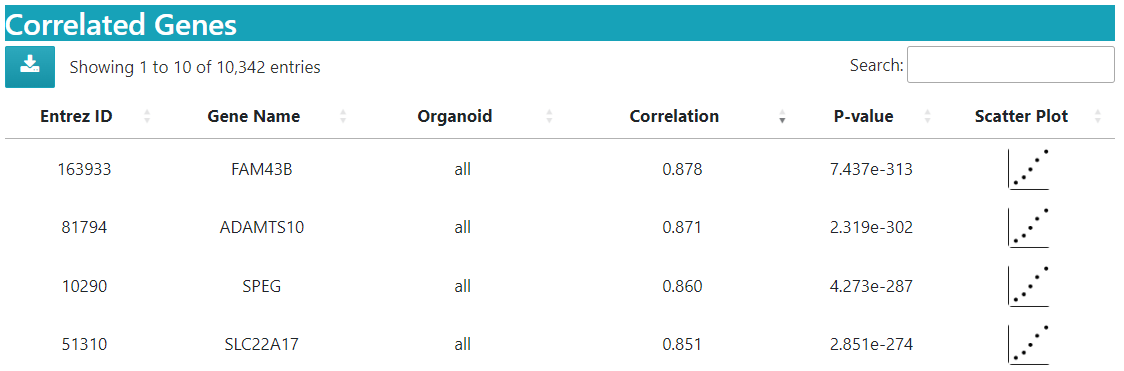
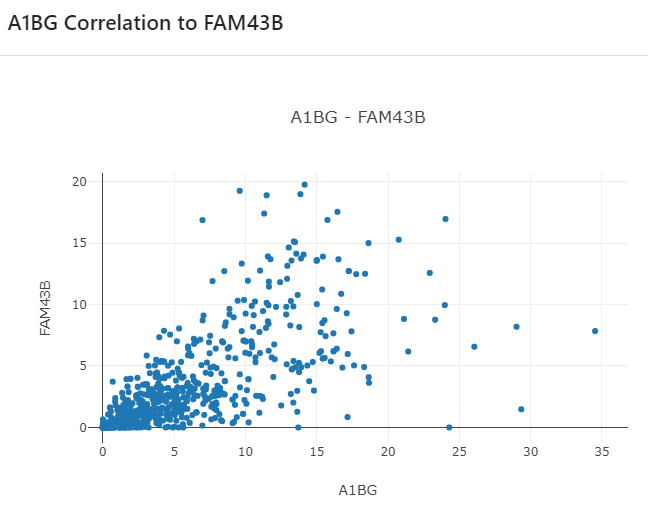
Clicking on scatter plot icon will display gene-gene correlation as shown below.
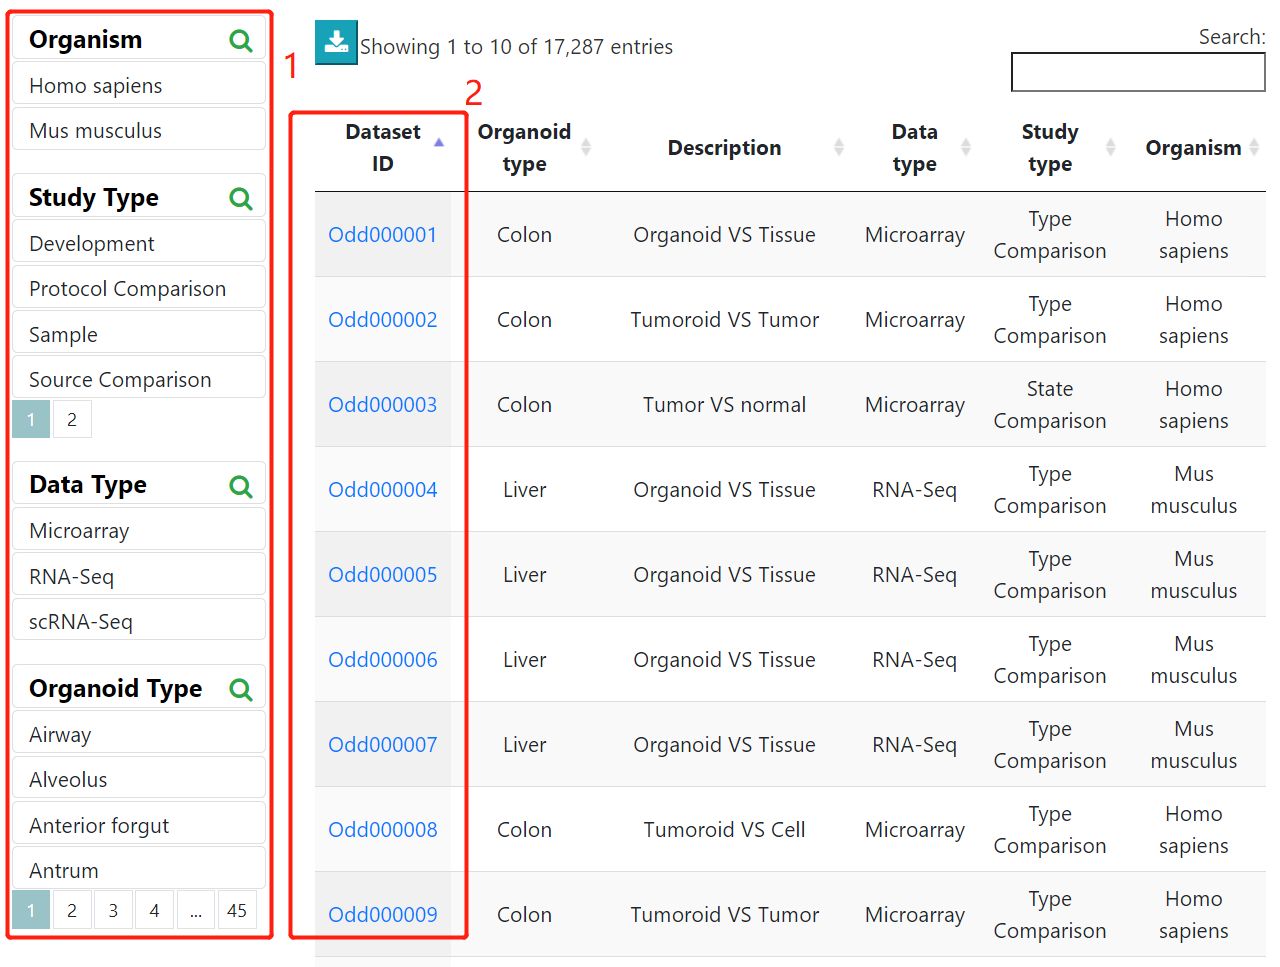
Browse
Users can browse through organoid datasets and samples using 1) filters such as organoid types, study types, and data types. 2) clicking the dataset ID will lead to a detailed information page showing corresponding organoid culture information, differential genes, enriched functions/pathways, differential cell type markers, cell clustering, marker genes when available.
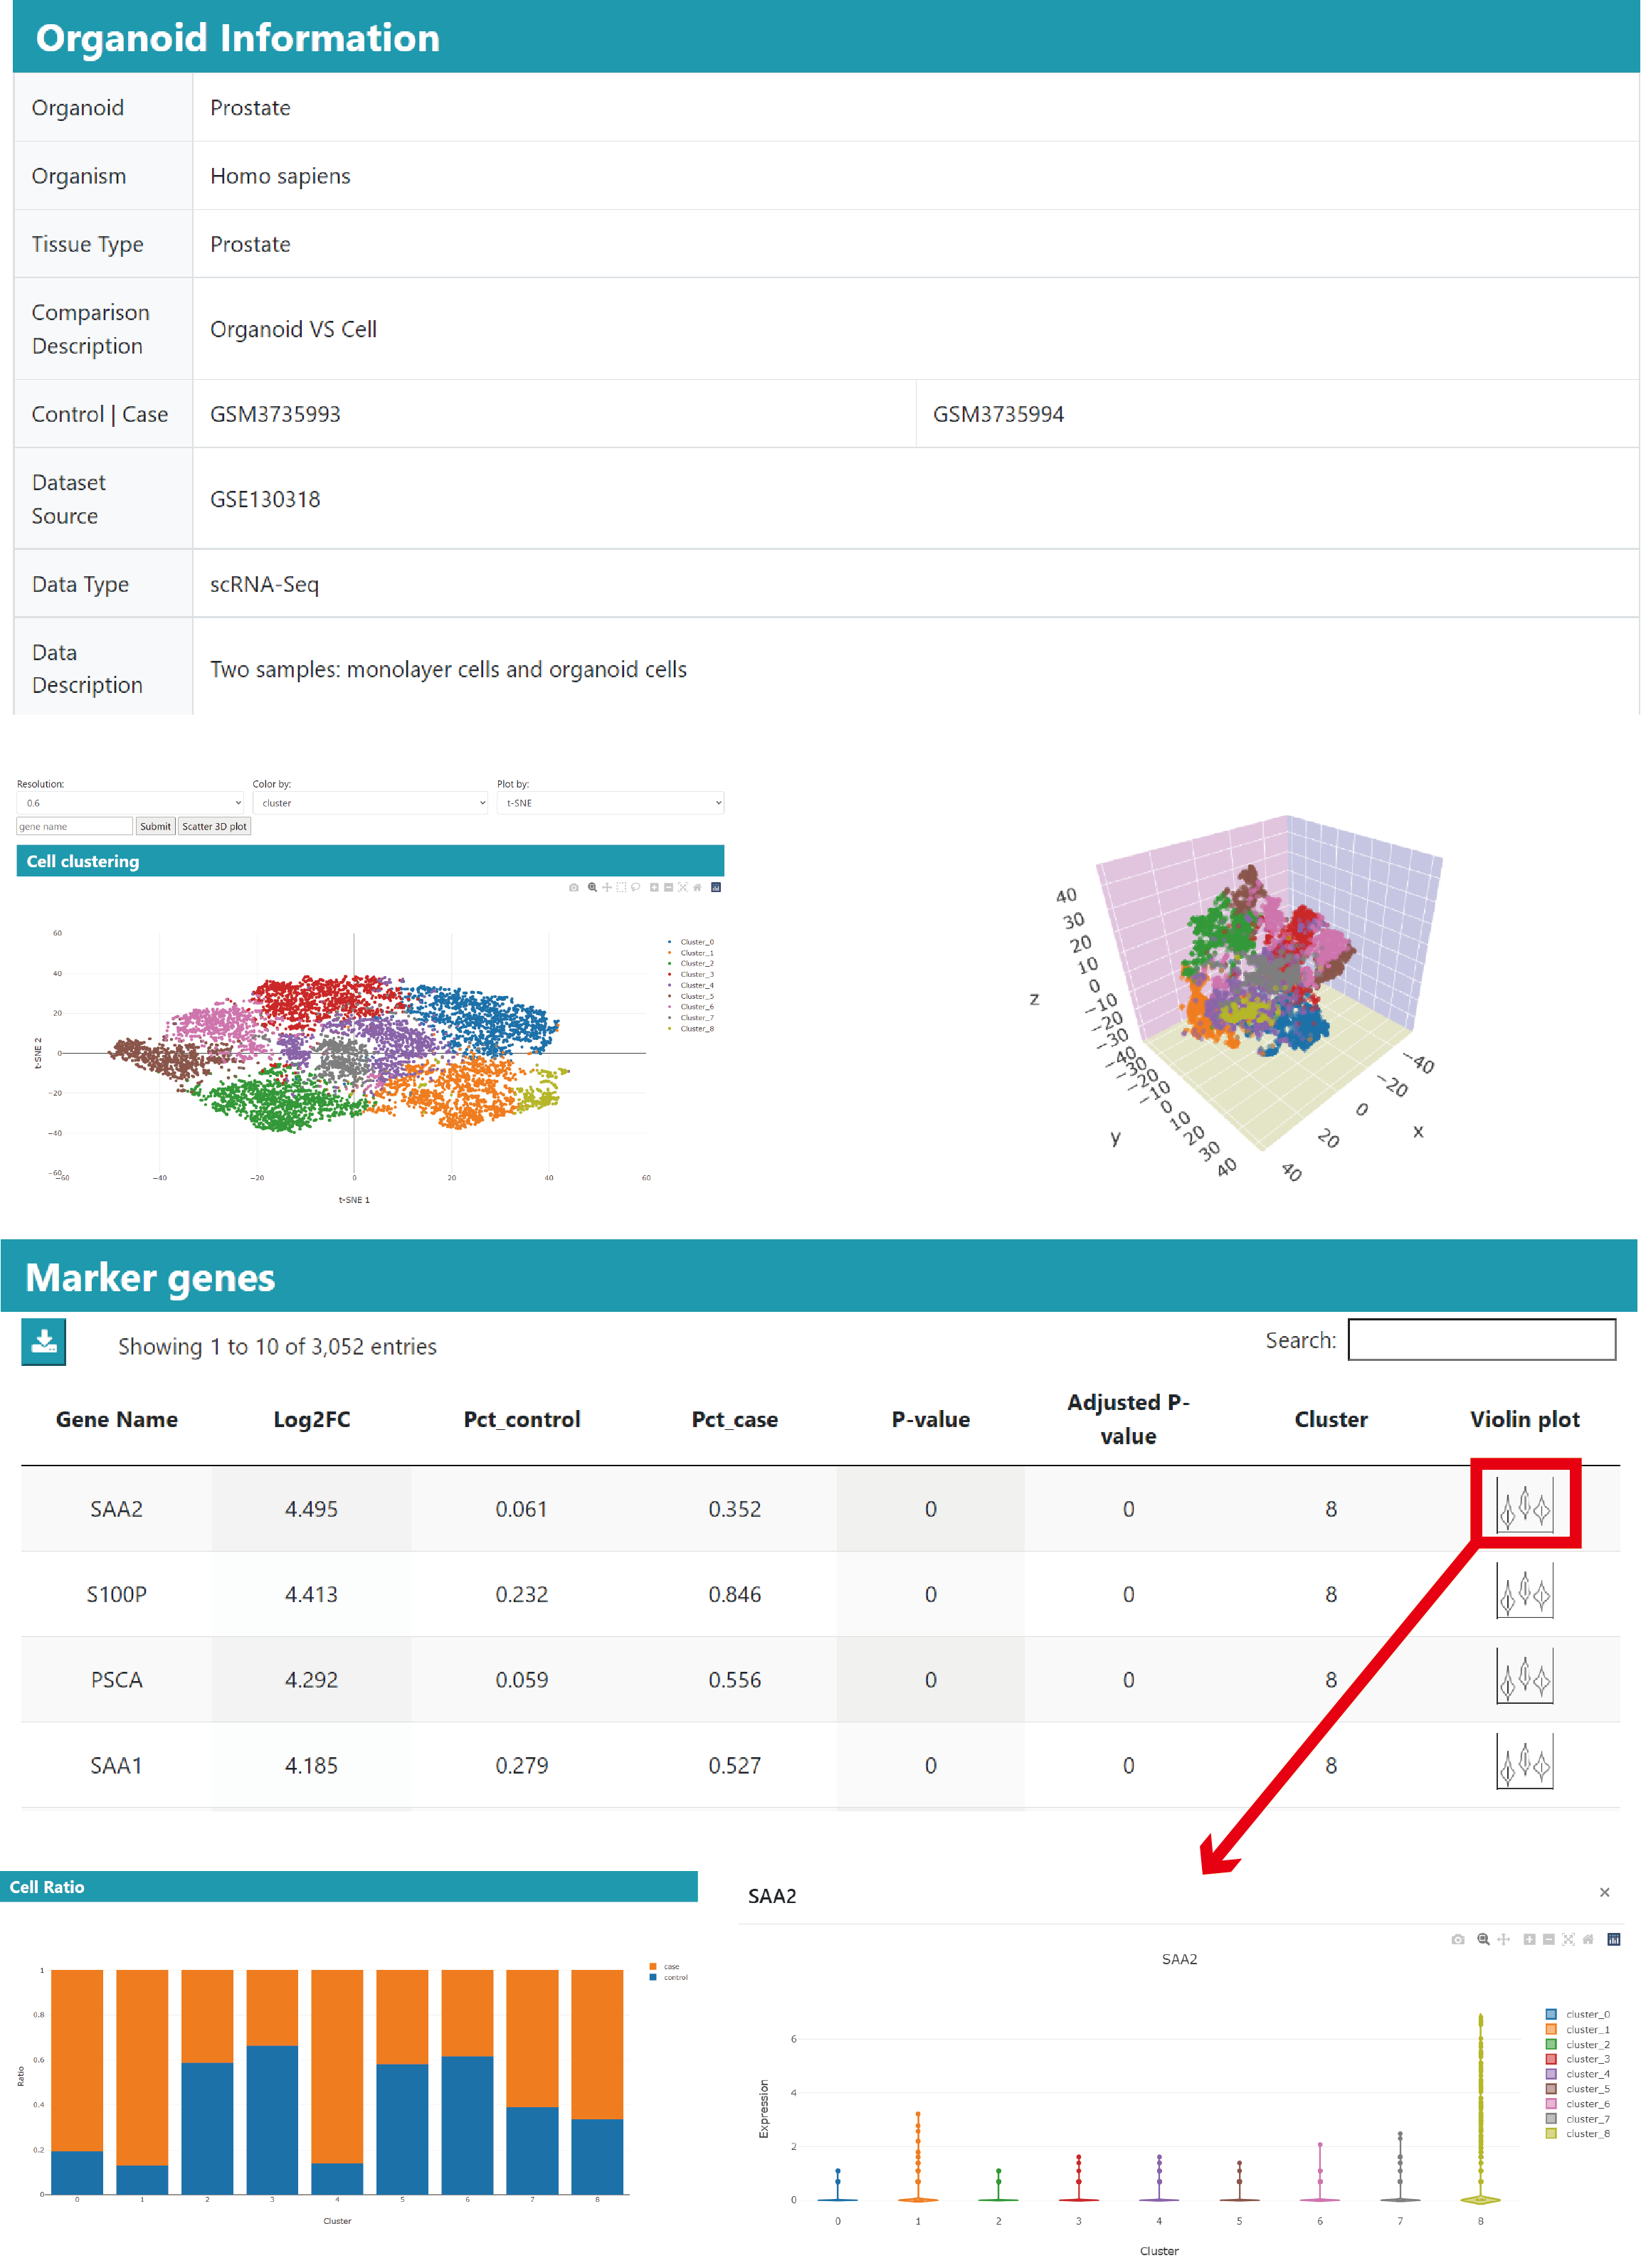
Detailed information page
The detailed information page contains the available organoid culture information, differential genes, enriched functions/pathways, differential cell type markers when available. Besides the overall analysis, the single-cell cluster analysis will generate the cell clustering plot with cell type annotation when available, cluster marker genes and differential genes in clusters.
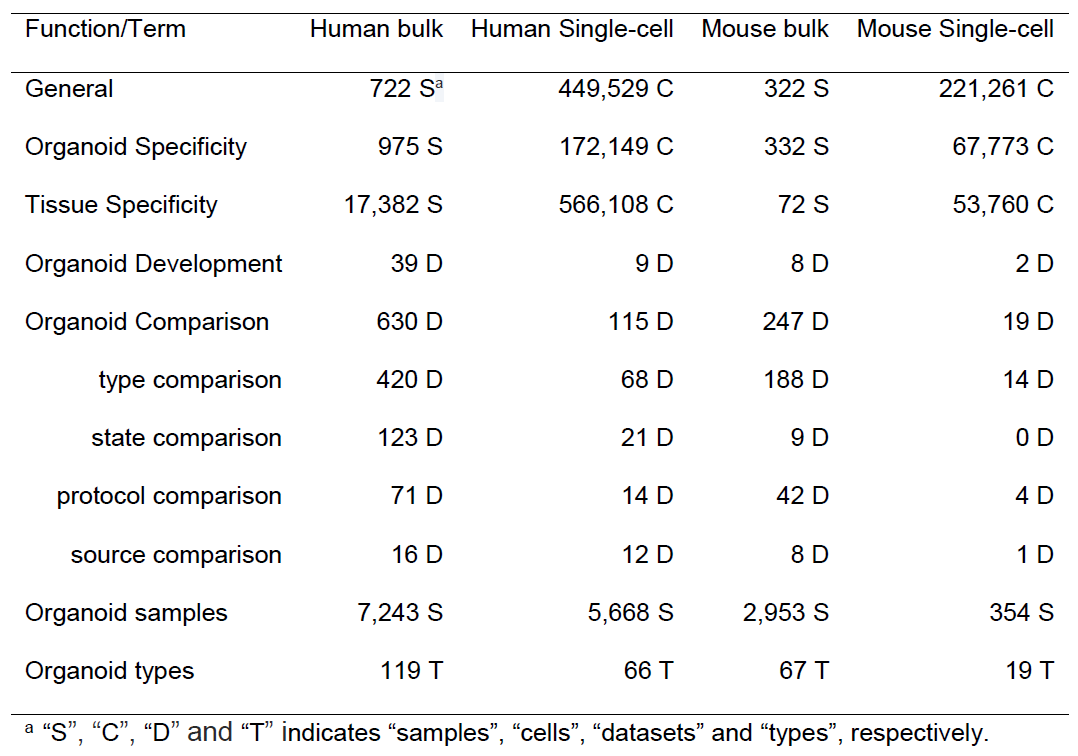
DB Statistics
Displays sample statistics of our database.
Feedback&Submit
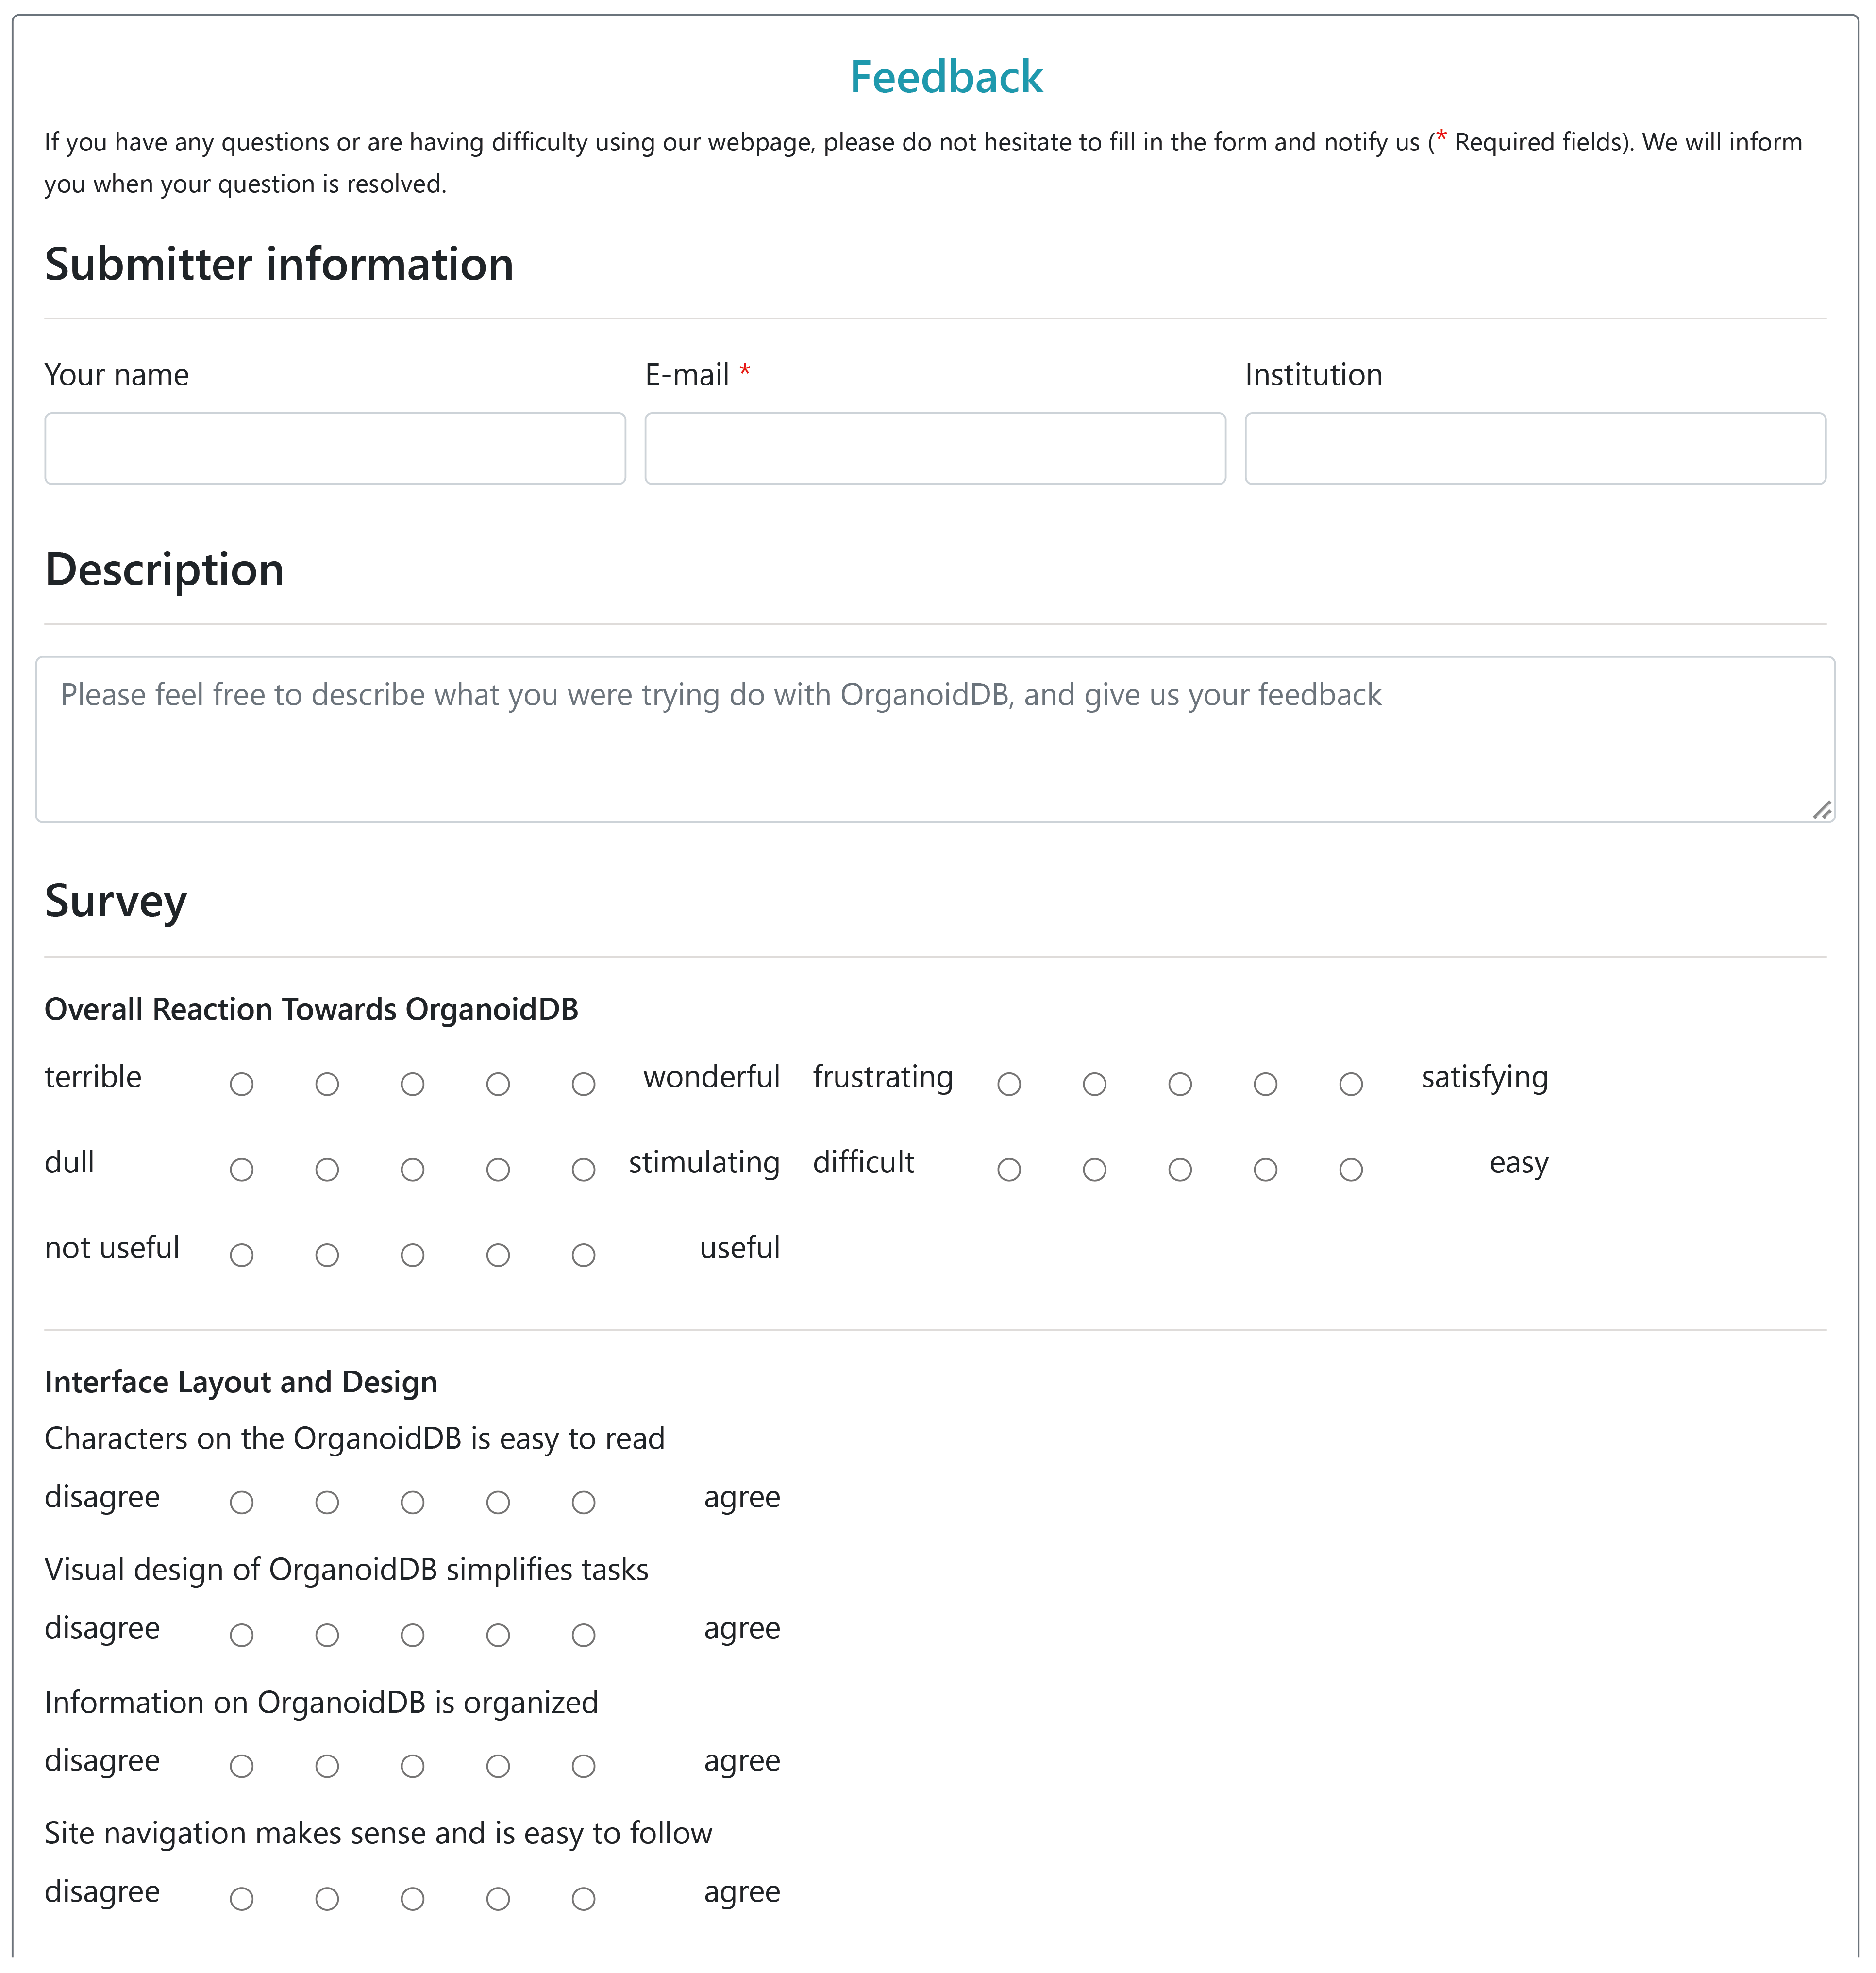
Feedback
Users were invited to fill a questionnaire to evaluate OrganoidDB on this page, which will help us to improve the use of OrganoidDB. The questionnaire collects information on the following: user intention, user satisfaction, platform usability, platform usefulness and platform ease of use. Users can give a short description of how they intend to use our platform and give a rating of whether they are successful in completing their tasks. In addition, users can also describe in detail their suggestions for OrganoidDB.
Submit
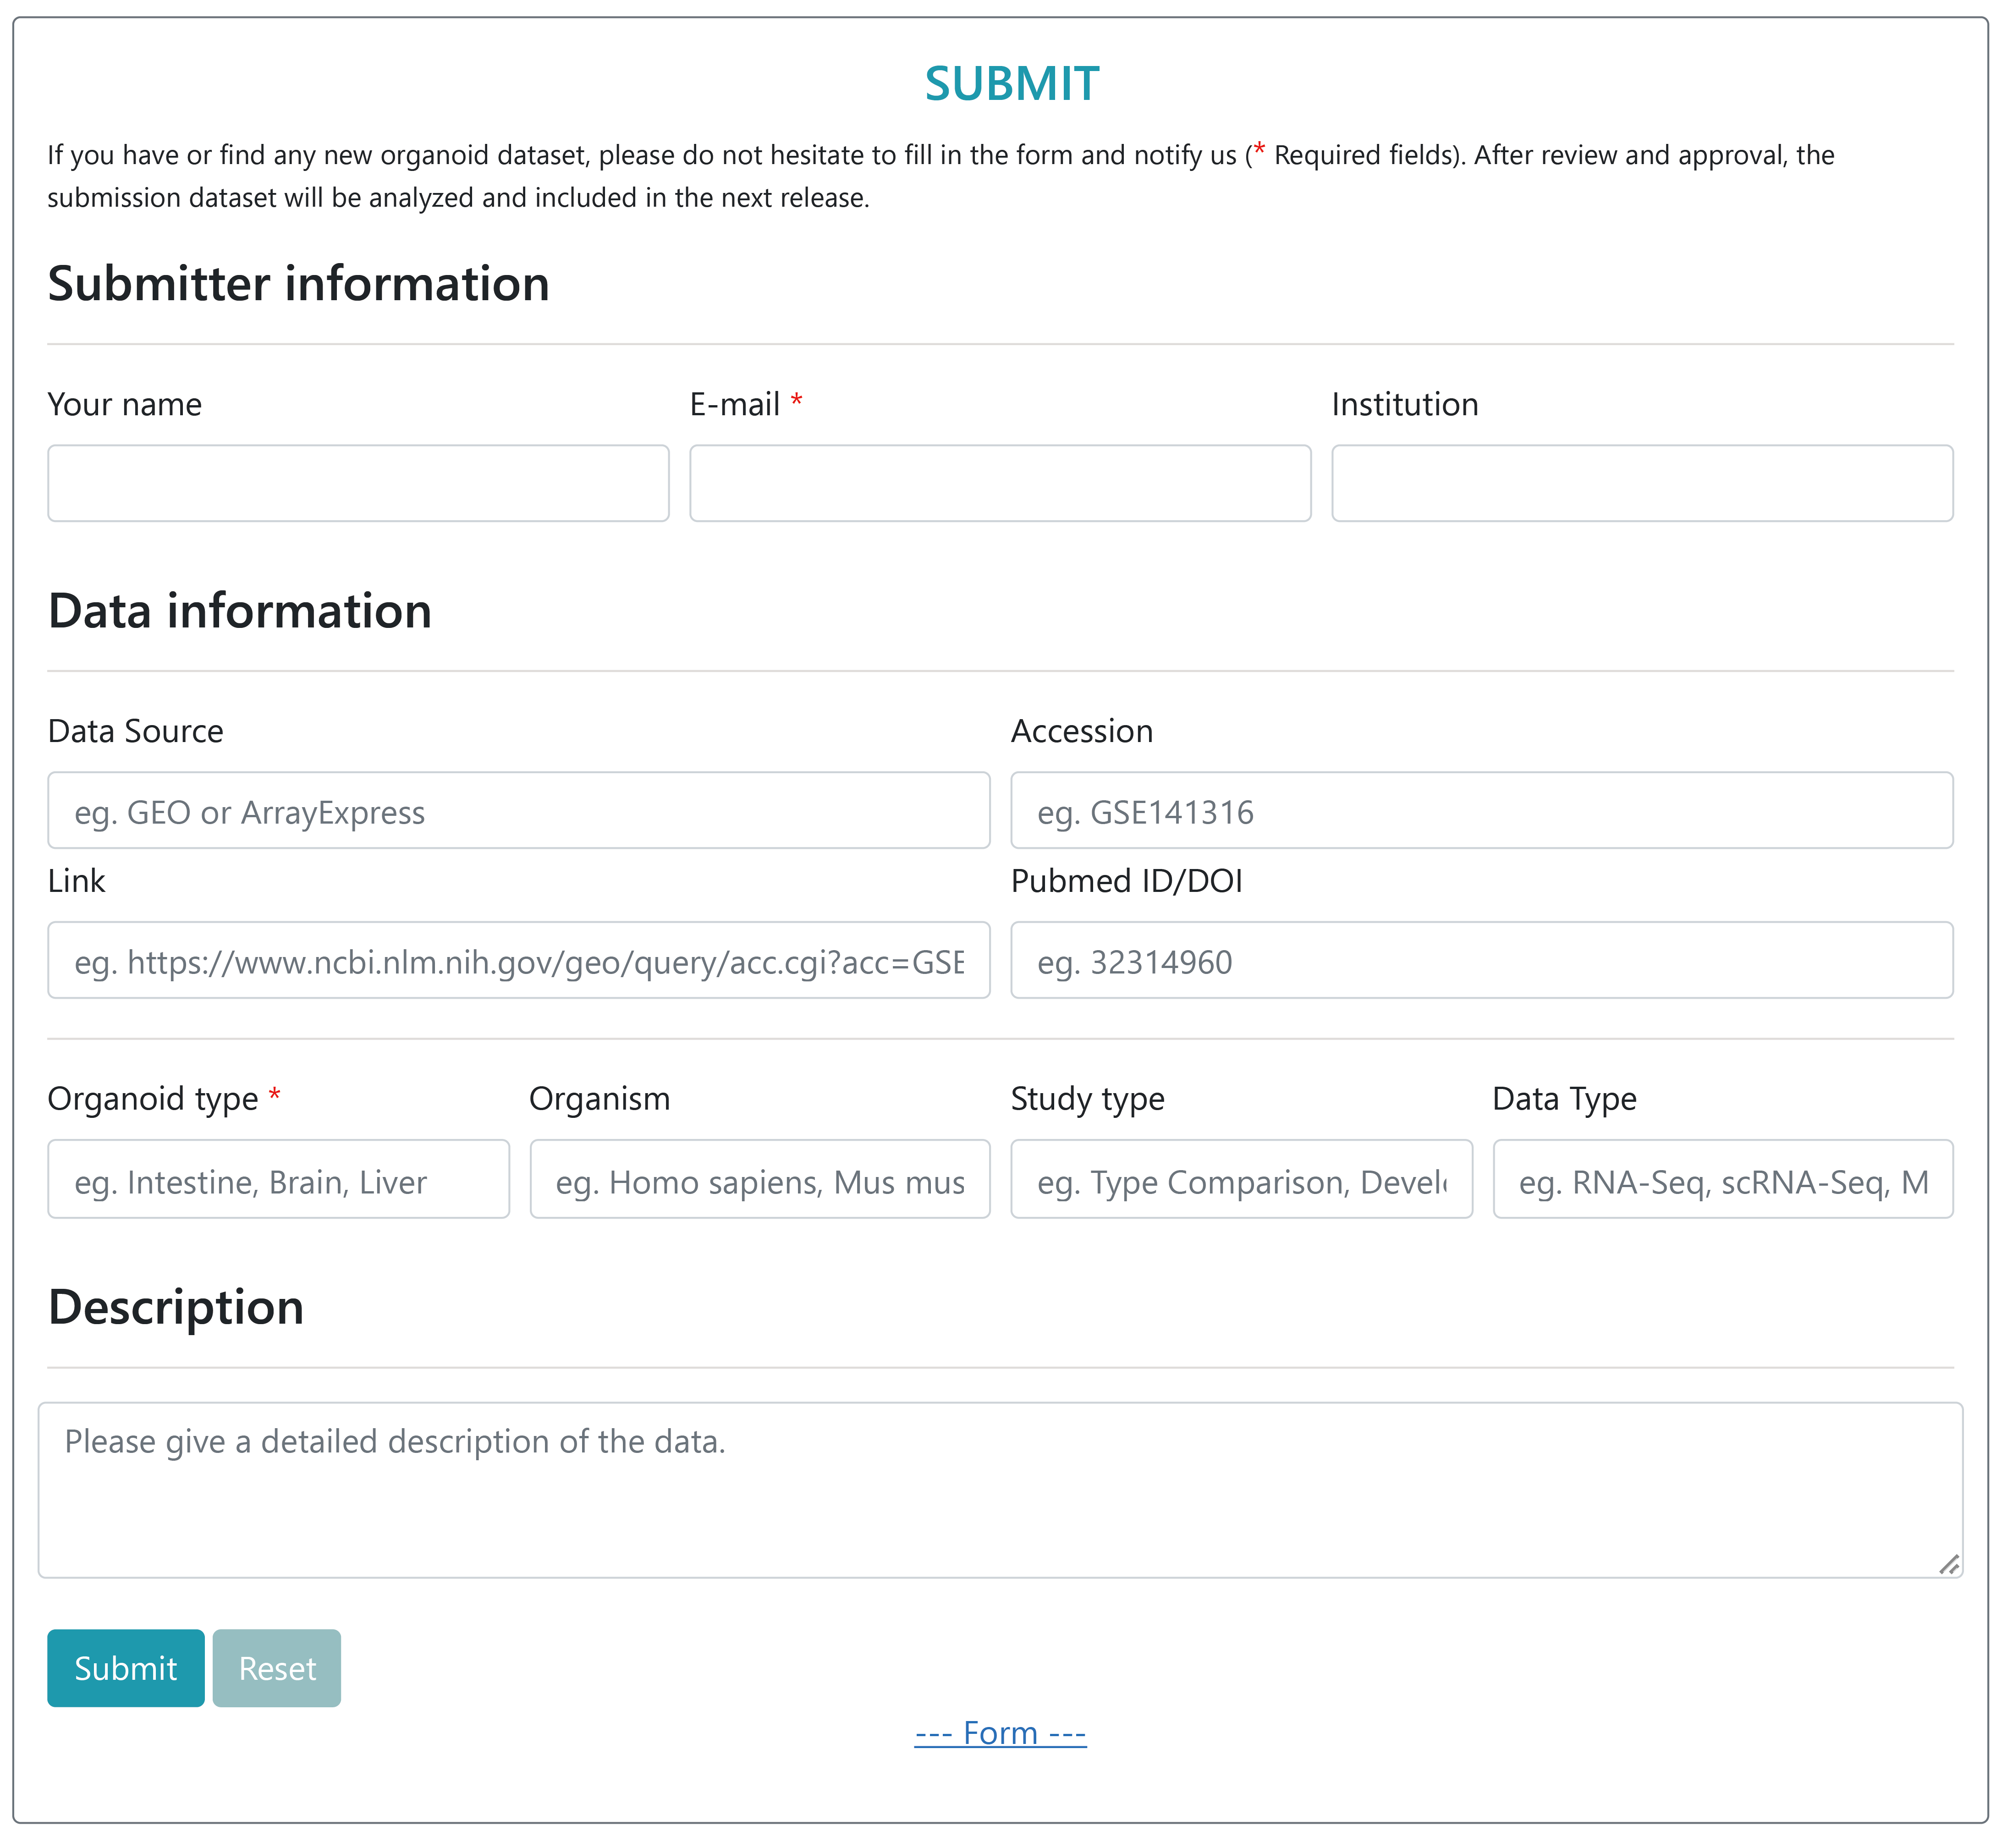
With the increase in organoid research, users are also encouraged to submit their own research data that meets the OrganoidDB data collation standards for future integration. Users can submit their name, e-mail(Required fields), and institution, as well as data source information such as GEO accession, link to the data source along with metadata describing the submission, including Orgnaoid Type, Organism, et.al. OrganoidDB will review the submission and automatically inform the submitter when their submission is included in the database.
- Please feel free to contact Professor Jianbo Pan with respect to any details pertaining to OrganoidDB
-
>Address :
Center for Novel Target and Therapeutic Intervention, Institute of Life Sciences, Chongqing Medical University,
No. 1 Yixueyuan Road, Yuzhong District, Chongqing, 400016, P. R. China.
-
>Email :
panjianbo@cqmu.edu.cn