Molecular signatures can be used as diagnostic, prognostic, predictive, and therapeutic markers for a particular disease. They are usually sets of genetic variants, mRNAs, proteins, metabolites or other variables, and they can be derived from a broad range of omics data types. Here, sets of differentially expressed genes in diseases compared to control samples are identified from bulk and single-cell transcriptomics datasets and defined as disease signatures.
A gene is declared differentially expressed if a difference or change observed in read counts or expression levels between two conditions (here, between diseased and healthy samples) is statistically significant.
Gene expression data of diseased and healthy samples are measured using microarray, bulk RNA-Seq and scRNA-Seq, et al. For microarray data, Limma is used for differential gene analysis. For bulk RNA-Seq data, hisat2/featurecounts are used, while CellRanger is applied for scRNA-Seq data. An adjusted P-value of less than 0.05 is considered statistically significant. If more than 1000 DEGs were found, only the top 1000 DEGs ranked by absolute log2 fold change were selected for downstream analysis.
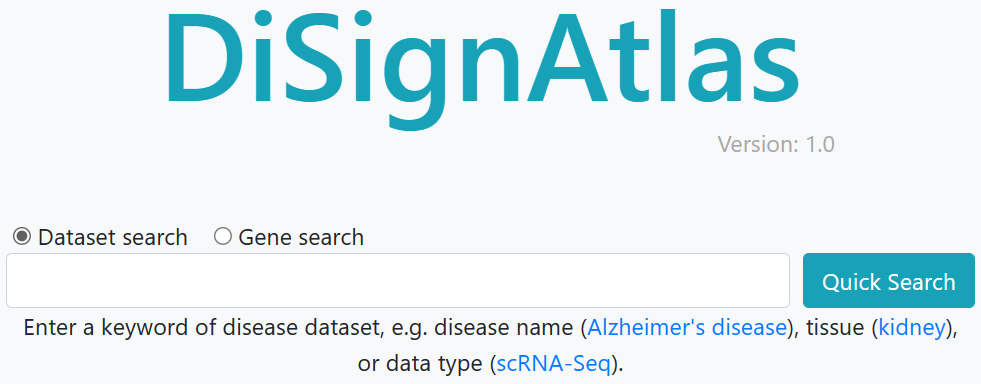
Users can conduct quick searches using disease keywords or gene information directly from the home page.
Search result page
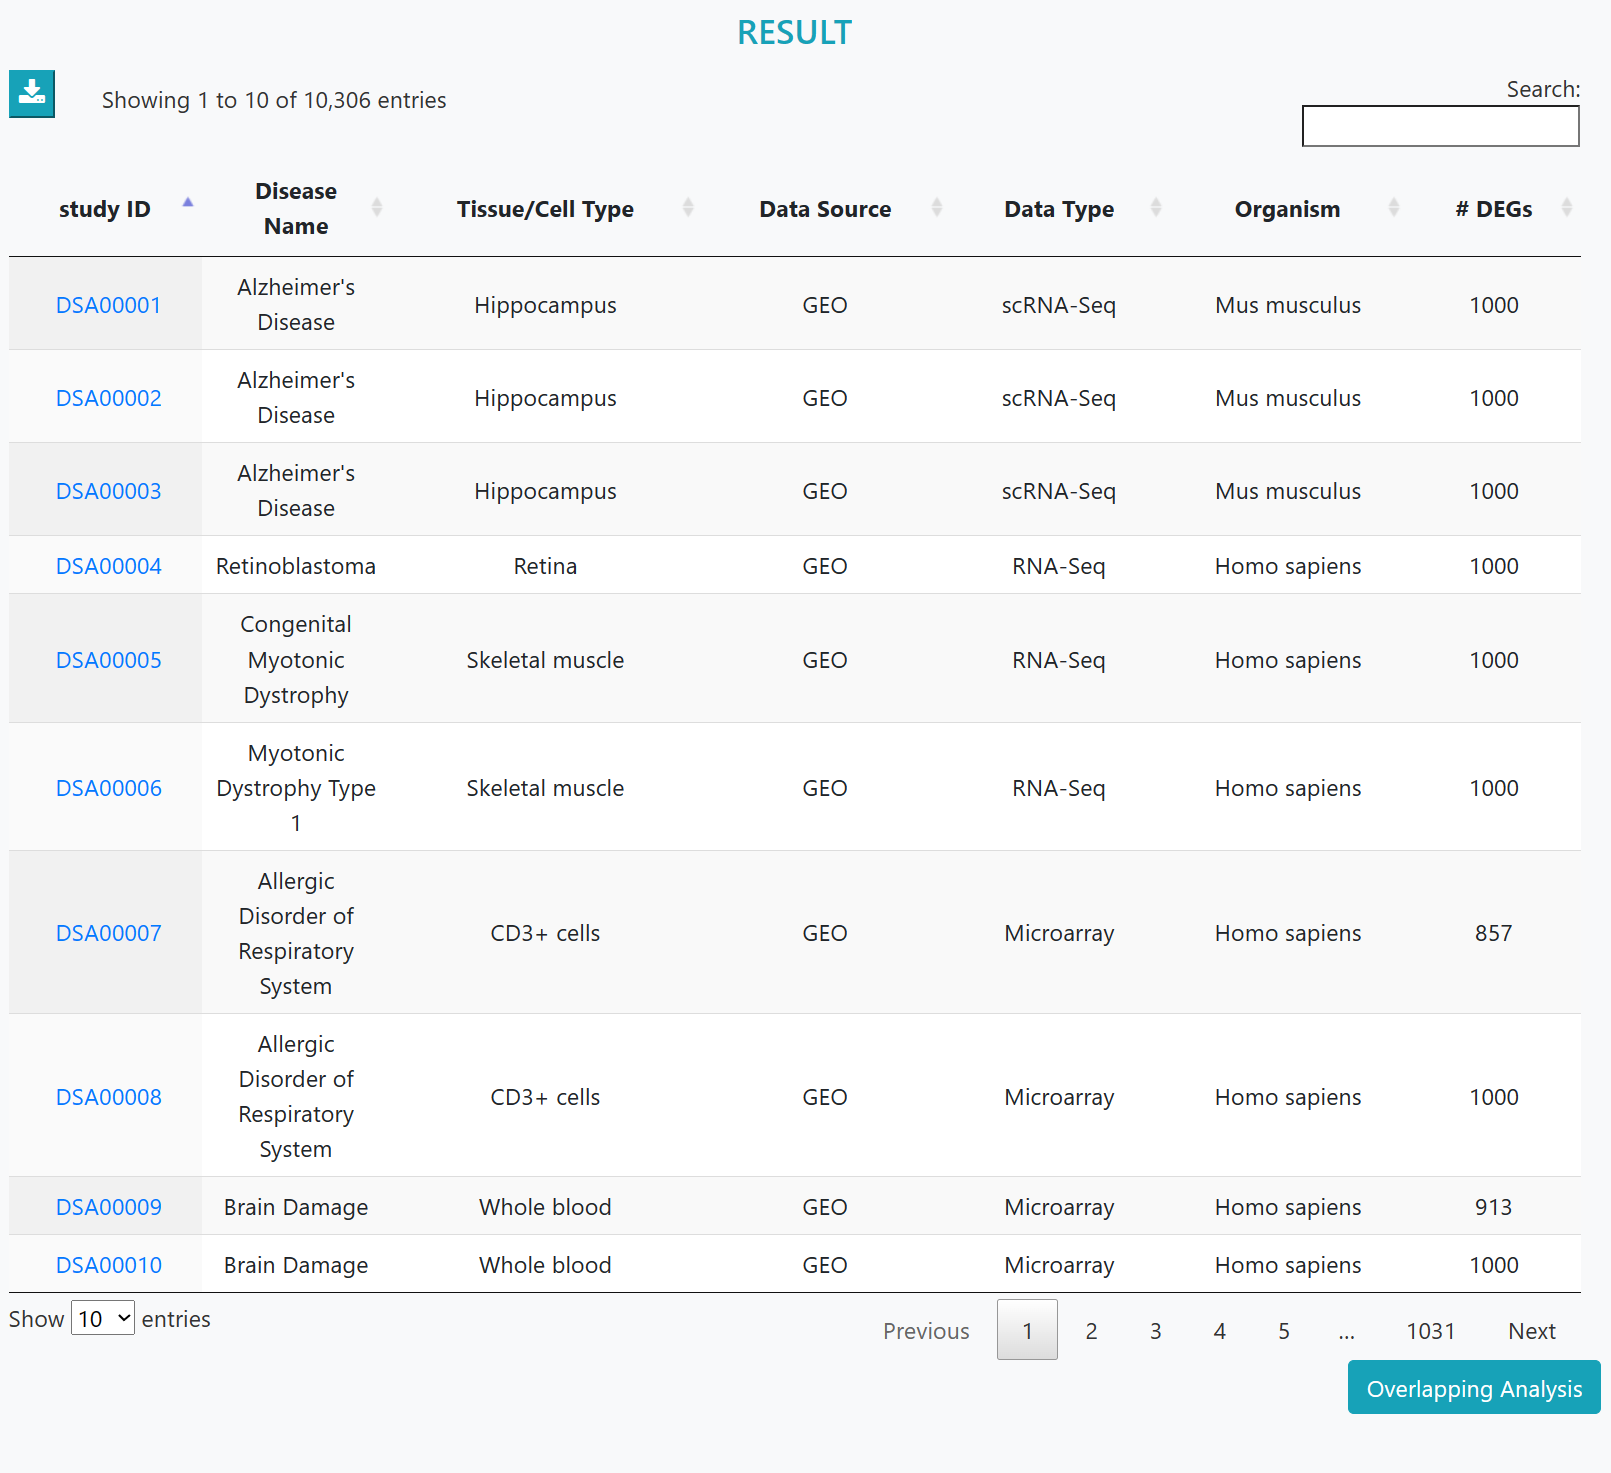
Disease datasets meeting the criteria are listed. Clicking on the dataset ID will lead to the detailed information page.
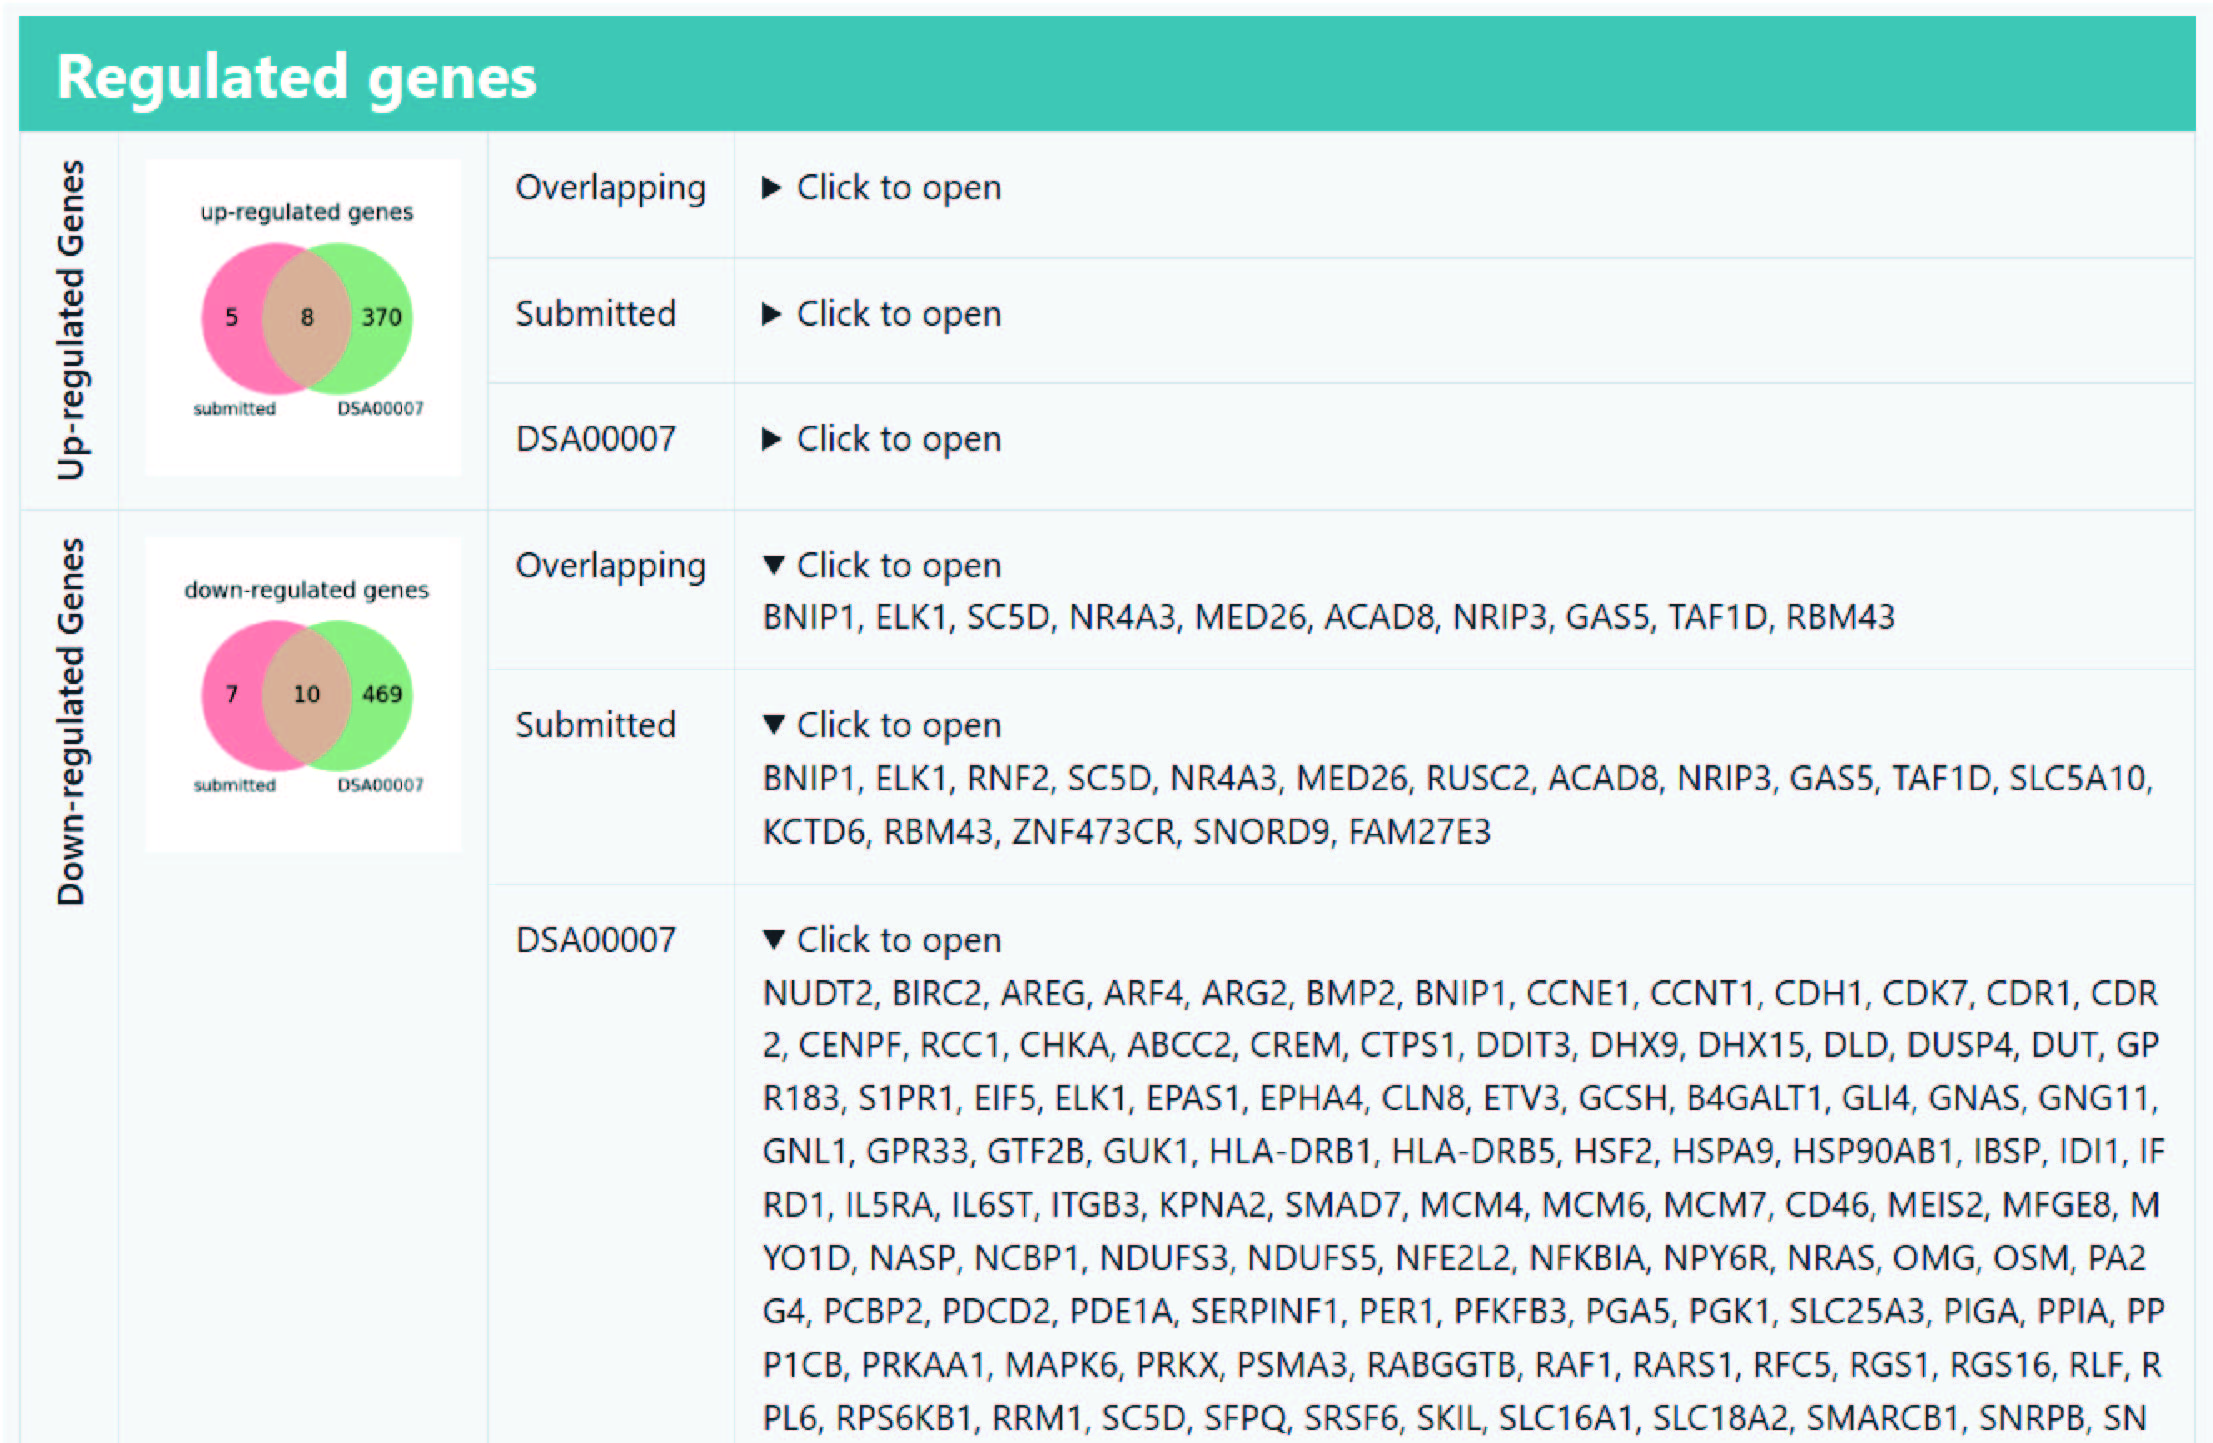
If more than 1 disease dataset were found, further overlapping analysis will be provided. The overlapping downstream DEGs of diseases will be shown in a network, while common functions/pathways of perturbed genes will be analyzed.
Detailed information page
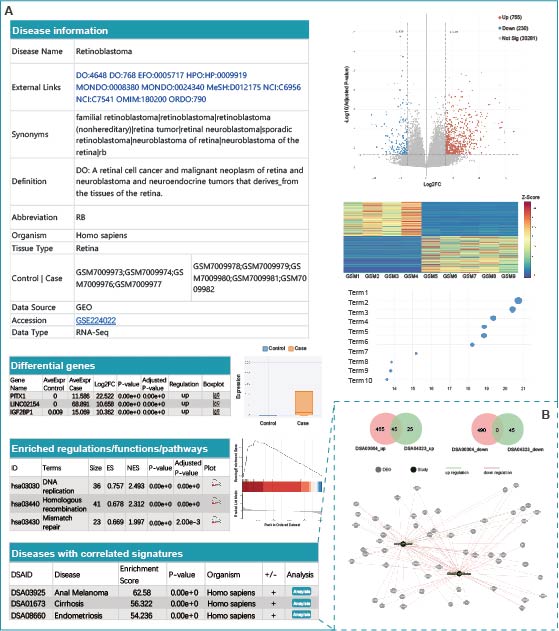
Detailed information for bulk datasets. (A) Various essential components of the disease dataset are shown, including disease information, disease definition, differential genes, enriched functions/pathways, and diseases with correlated signatures. (B) Clicking on the "Analysis" button leads to a page that comprehensively illustrates the overlapping DEGs and functional enrichment results.
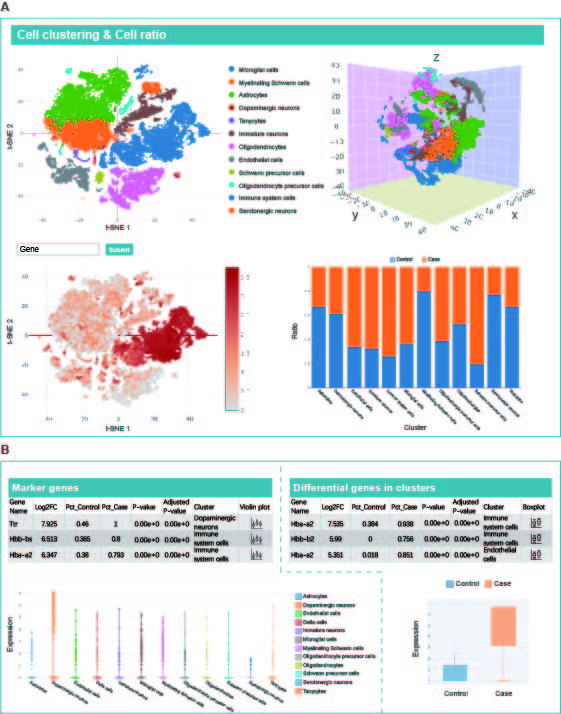
Detailed information for single-cell datasets. (A) Cluster analysis of single-cell data. (B) Visualization of marker genes and differentially expressed genes in distinct cell populations.
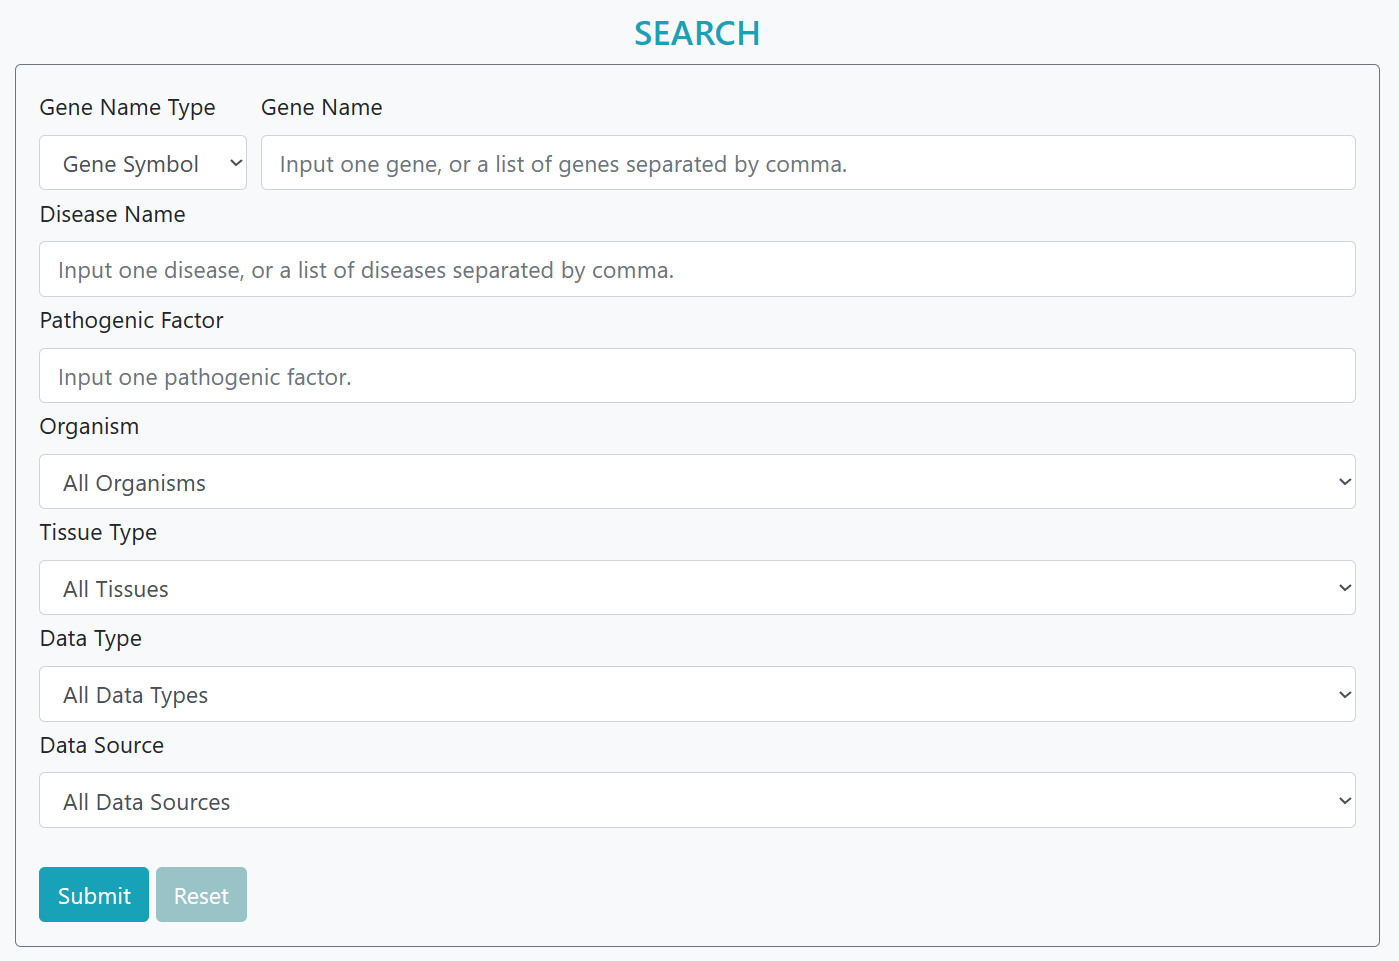
Advanced and more accurate search was developed based on the matchings of features of disease dataset including disease name, data type, organisms and tissue type
Step 1: Input disease name
Step 2: Select types, e.g. data type, tissue type
Step 3: Submit.
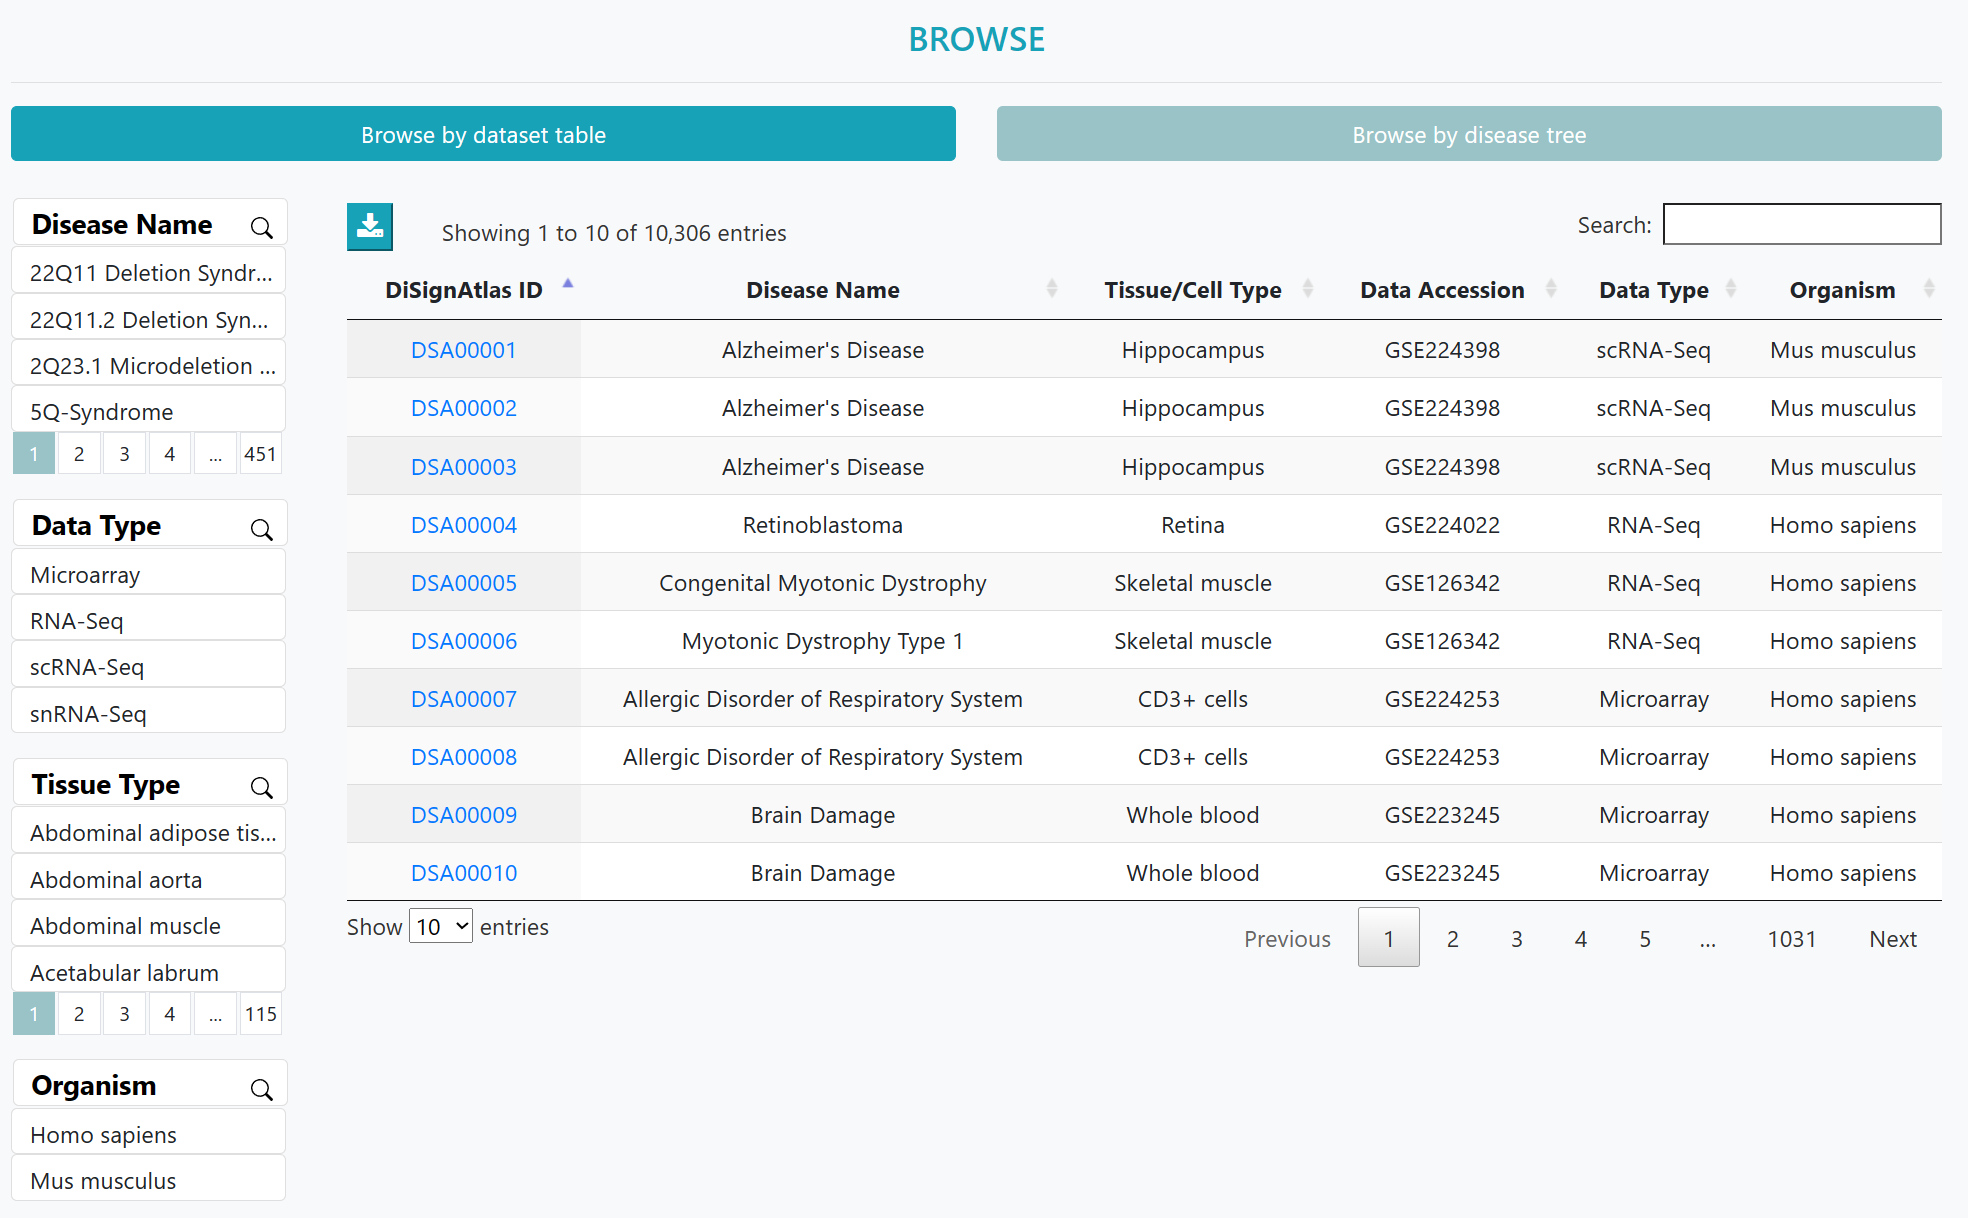
The list of disease datasets could be viewed in an interactive table on this page. Users can customize filters using "Disease Type", "Data Type", "Tissue Type" and "Organism". Then users can click on "Dataset ID" to view the corresponding detailed information page.
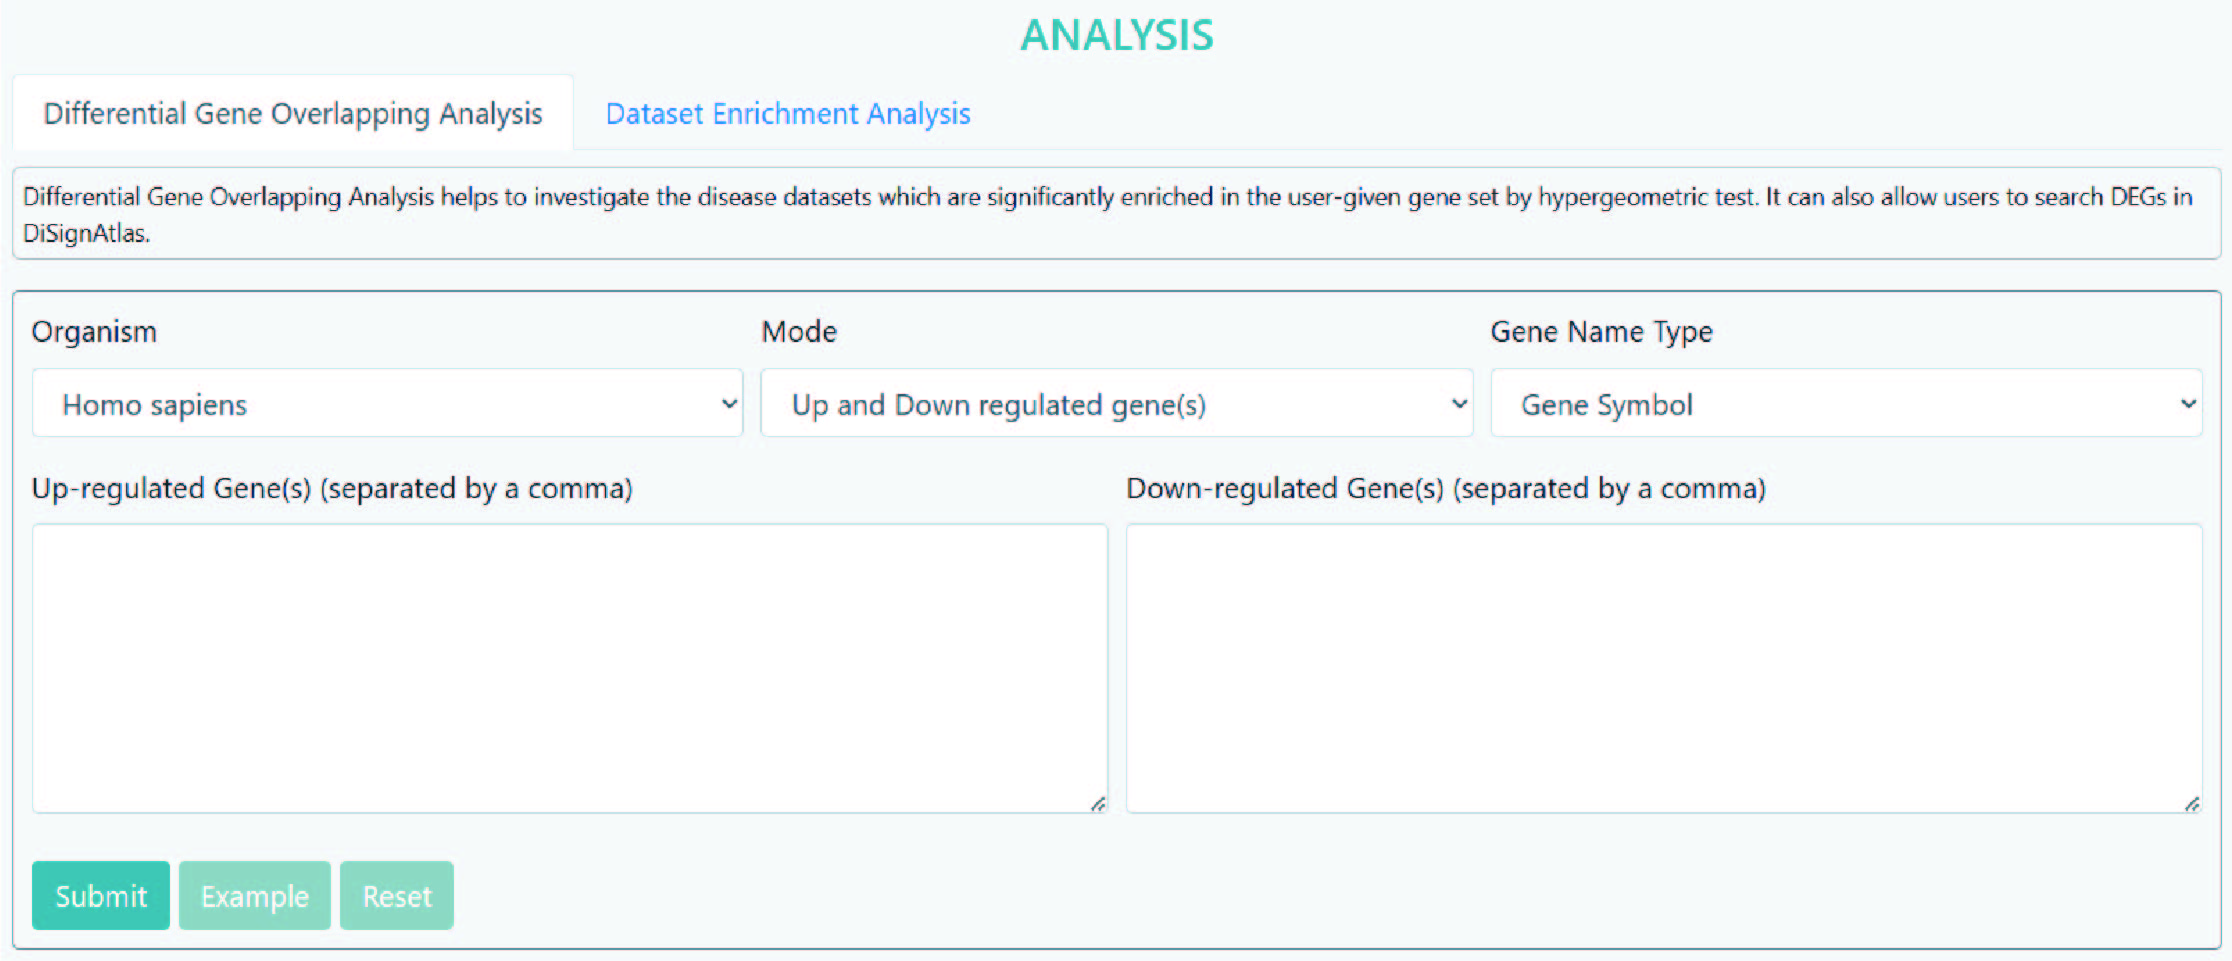
>Differential Gene Overlapping Analysis
Differential Gene Overlapping Analysis helps to investigate the disease datasets which are significantly enriched in the user-given gene set by hypergeometric test. It can also allow users to search DEGs in DiSignAtlas.
Step 1: Select an organism.
Step 2: Select a gene type e.g. up-regulated gene, down-regulated gene or differential gene.
Step 3: Input the gene name(s)/ID(s), multiple items should be separated using commas, e.g., "14,18,52".
Step 4: Submit.
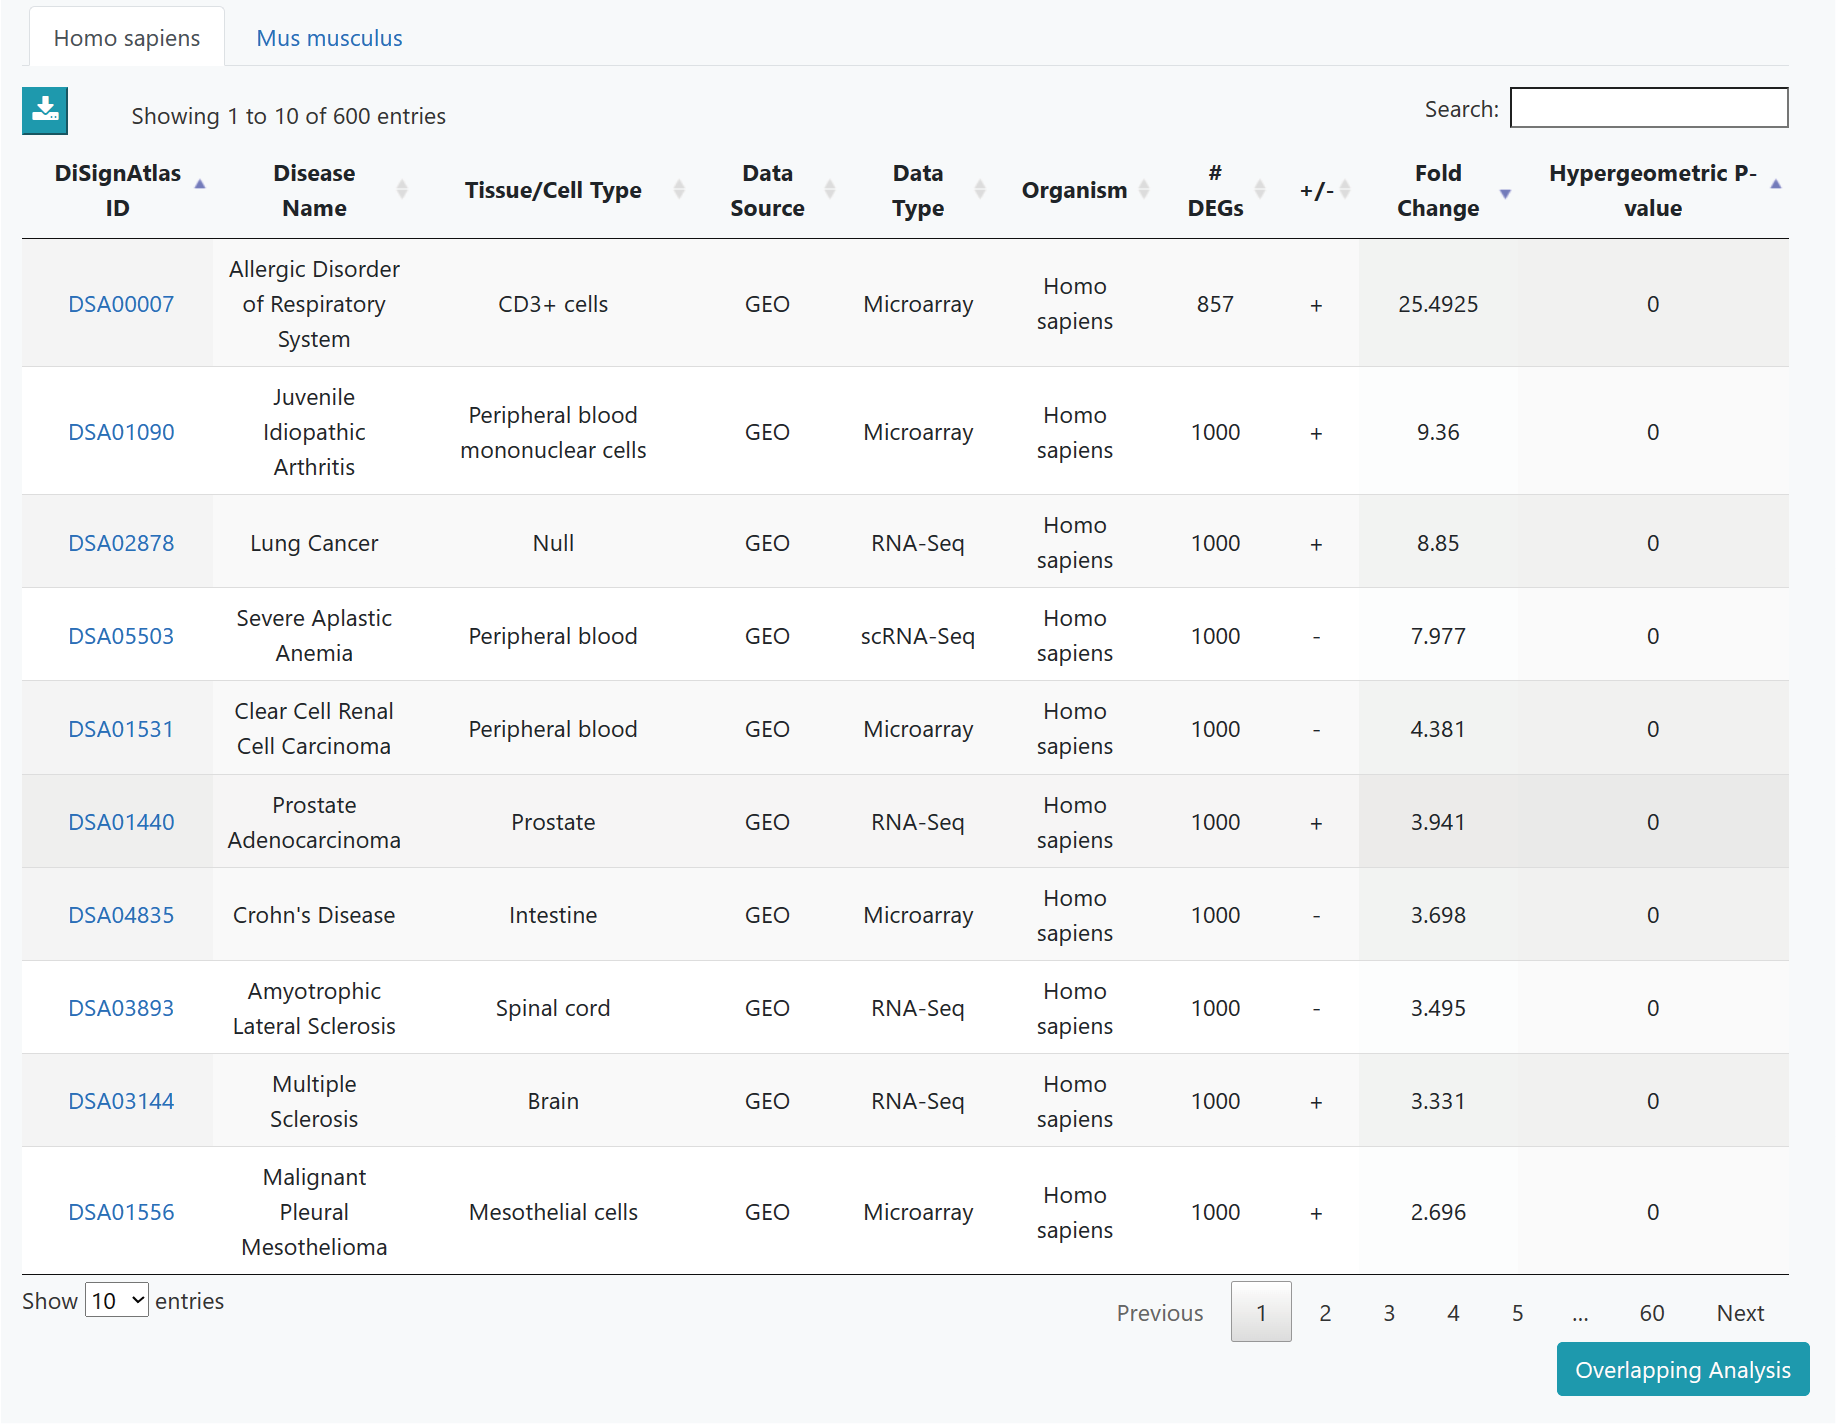
As the results, the DiSignAtlas datasets in which DEG list includes submitted genes are given. Hypergeometric p-values are provided for each dataset.
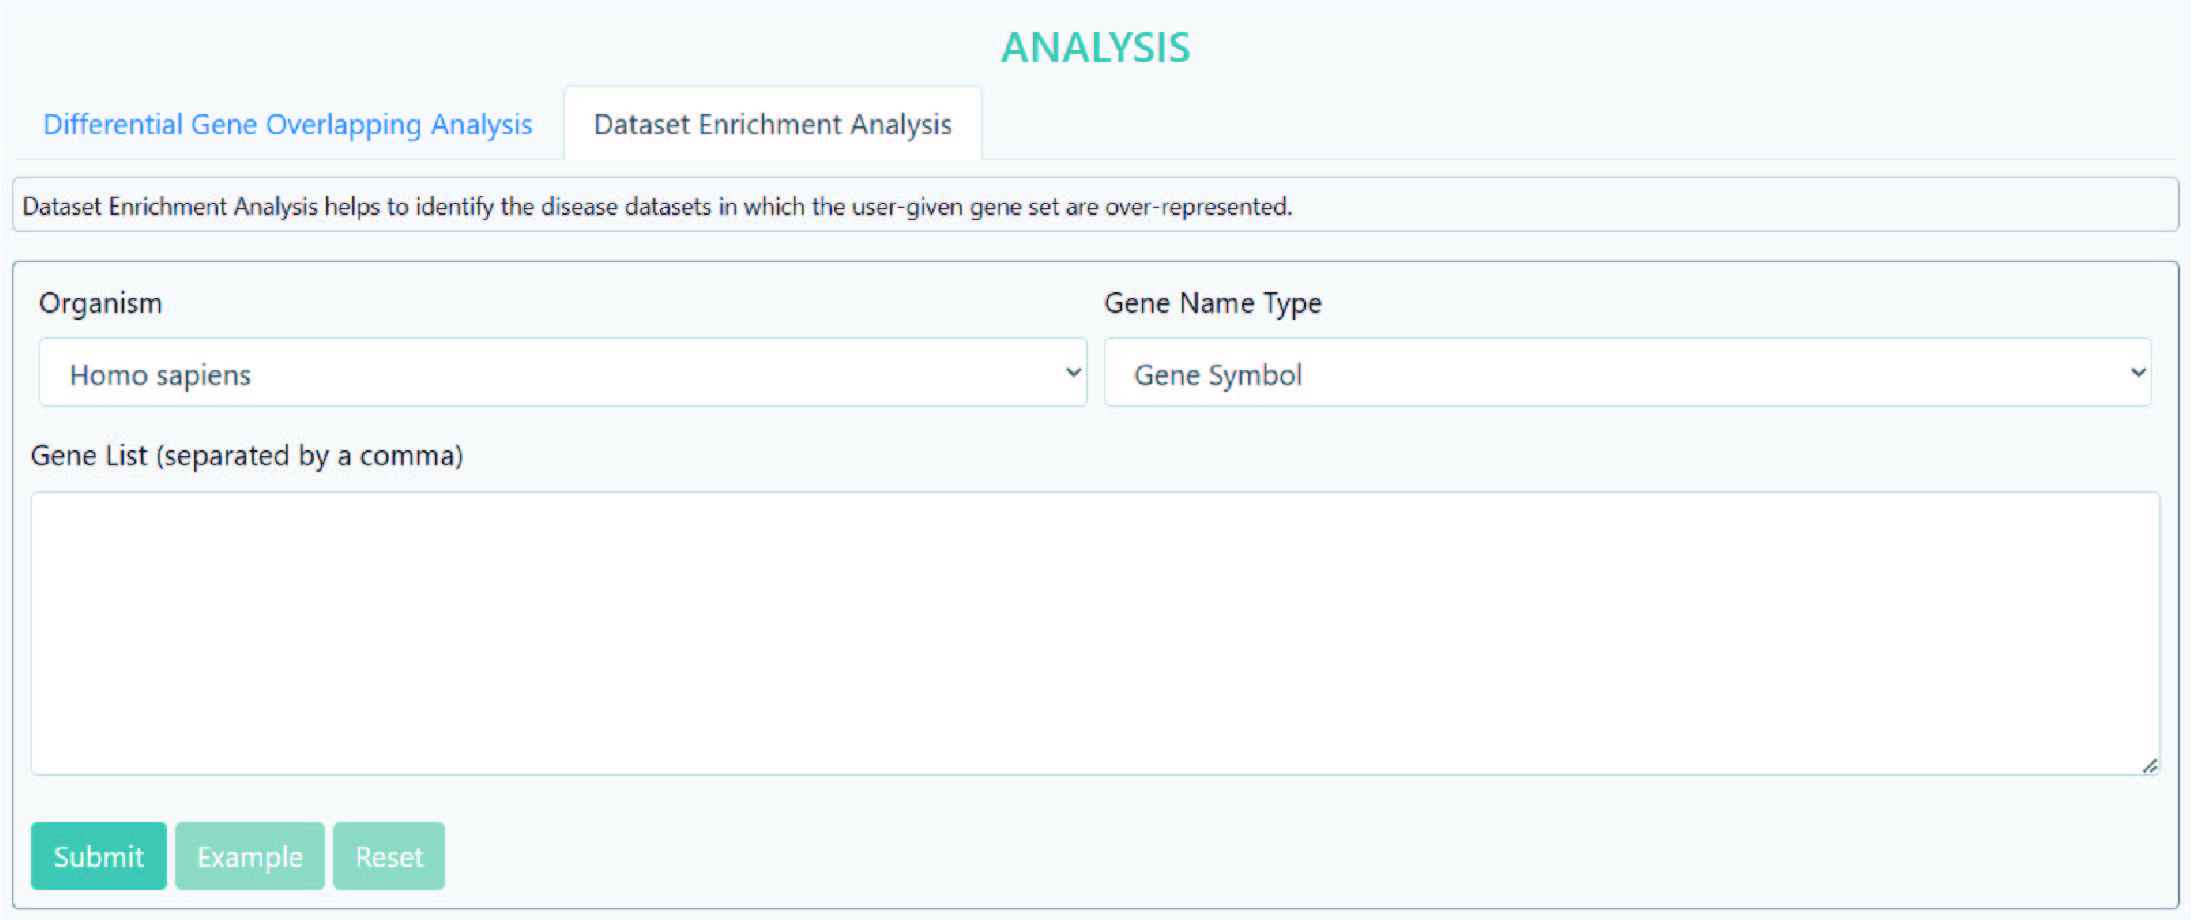
>Dataset Enrichment Analysis
Dataset Enrichment Analysis helps to identify the disease datasets in which the user-given gene set are over-represented.
Step 1: Select an organism.
Step 2: Select a gene type e.g. up-regulated gene, down-regulated gene or differential gene.
Step 3: Input the gene name(s)/ID(s), multiple items should be separated using commas, e.g., "14,18,52".
Step 4: Submit.
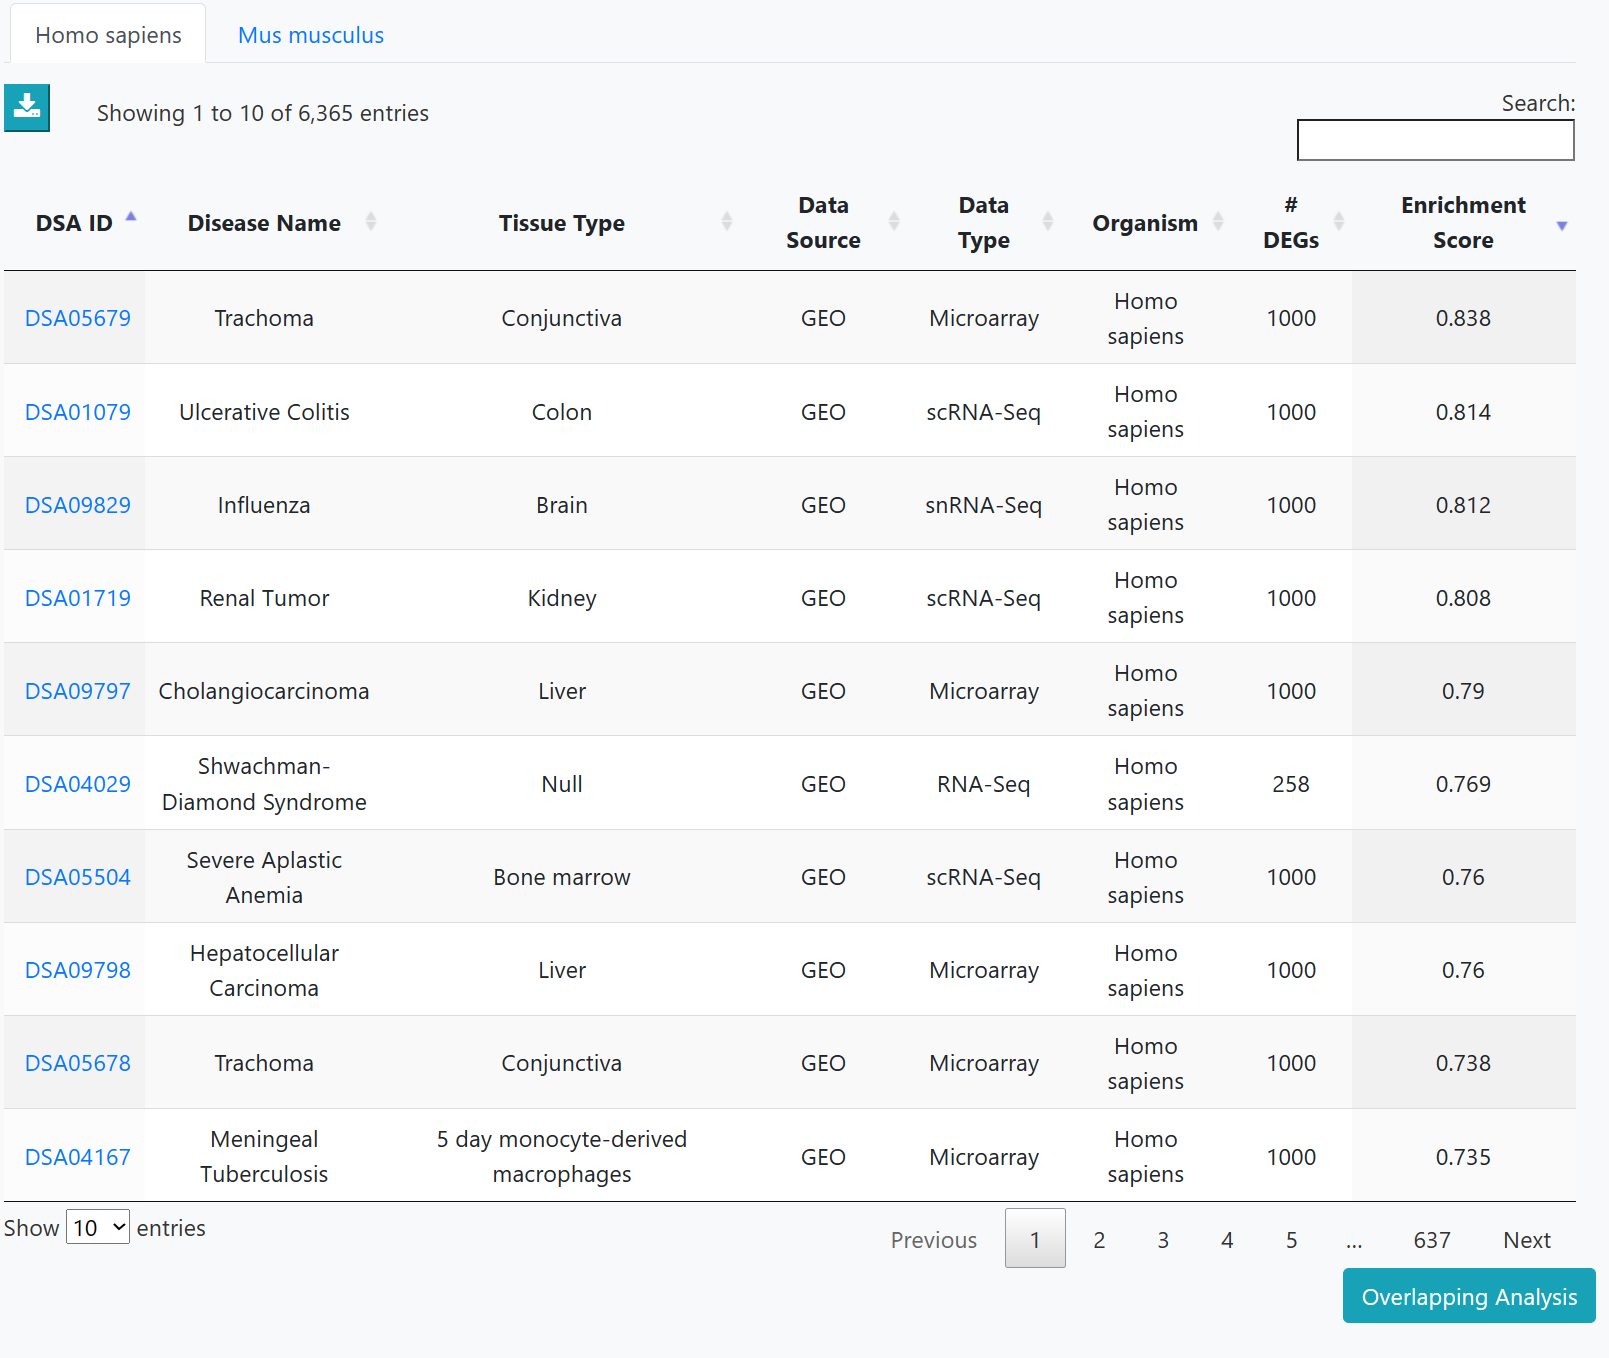
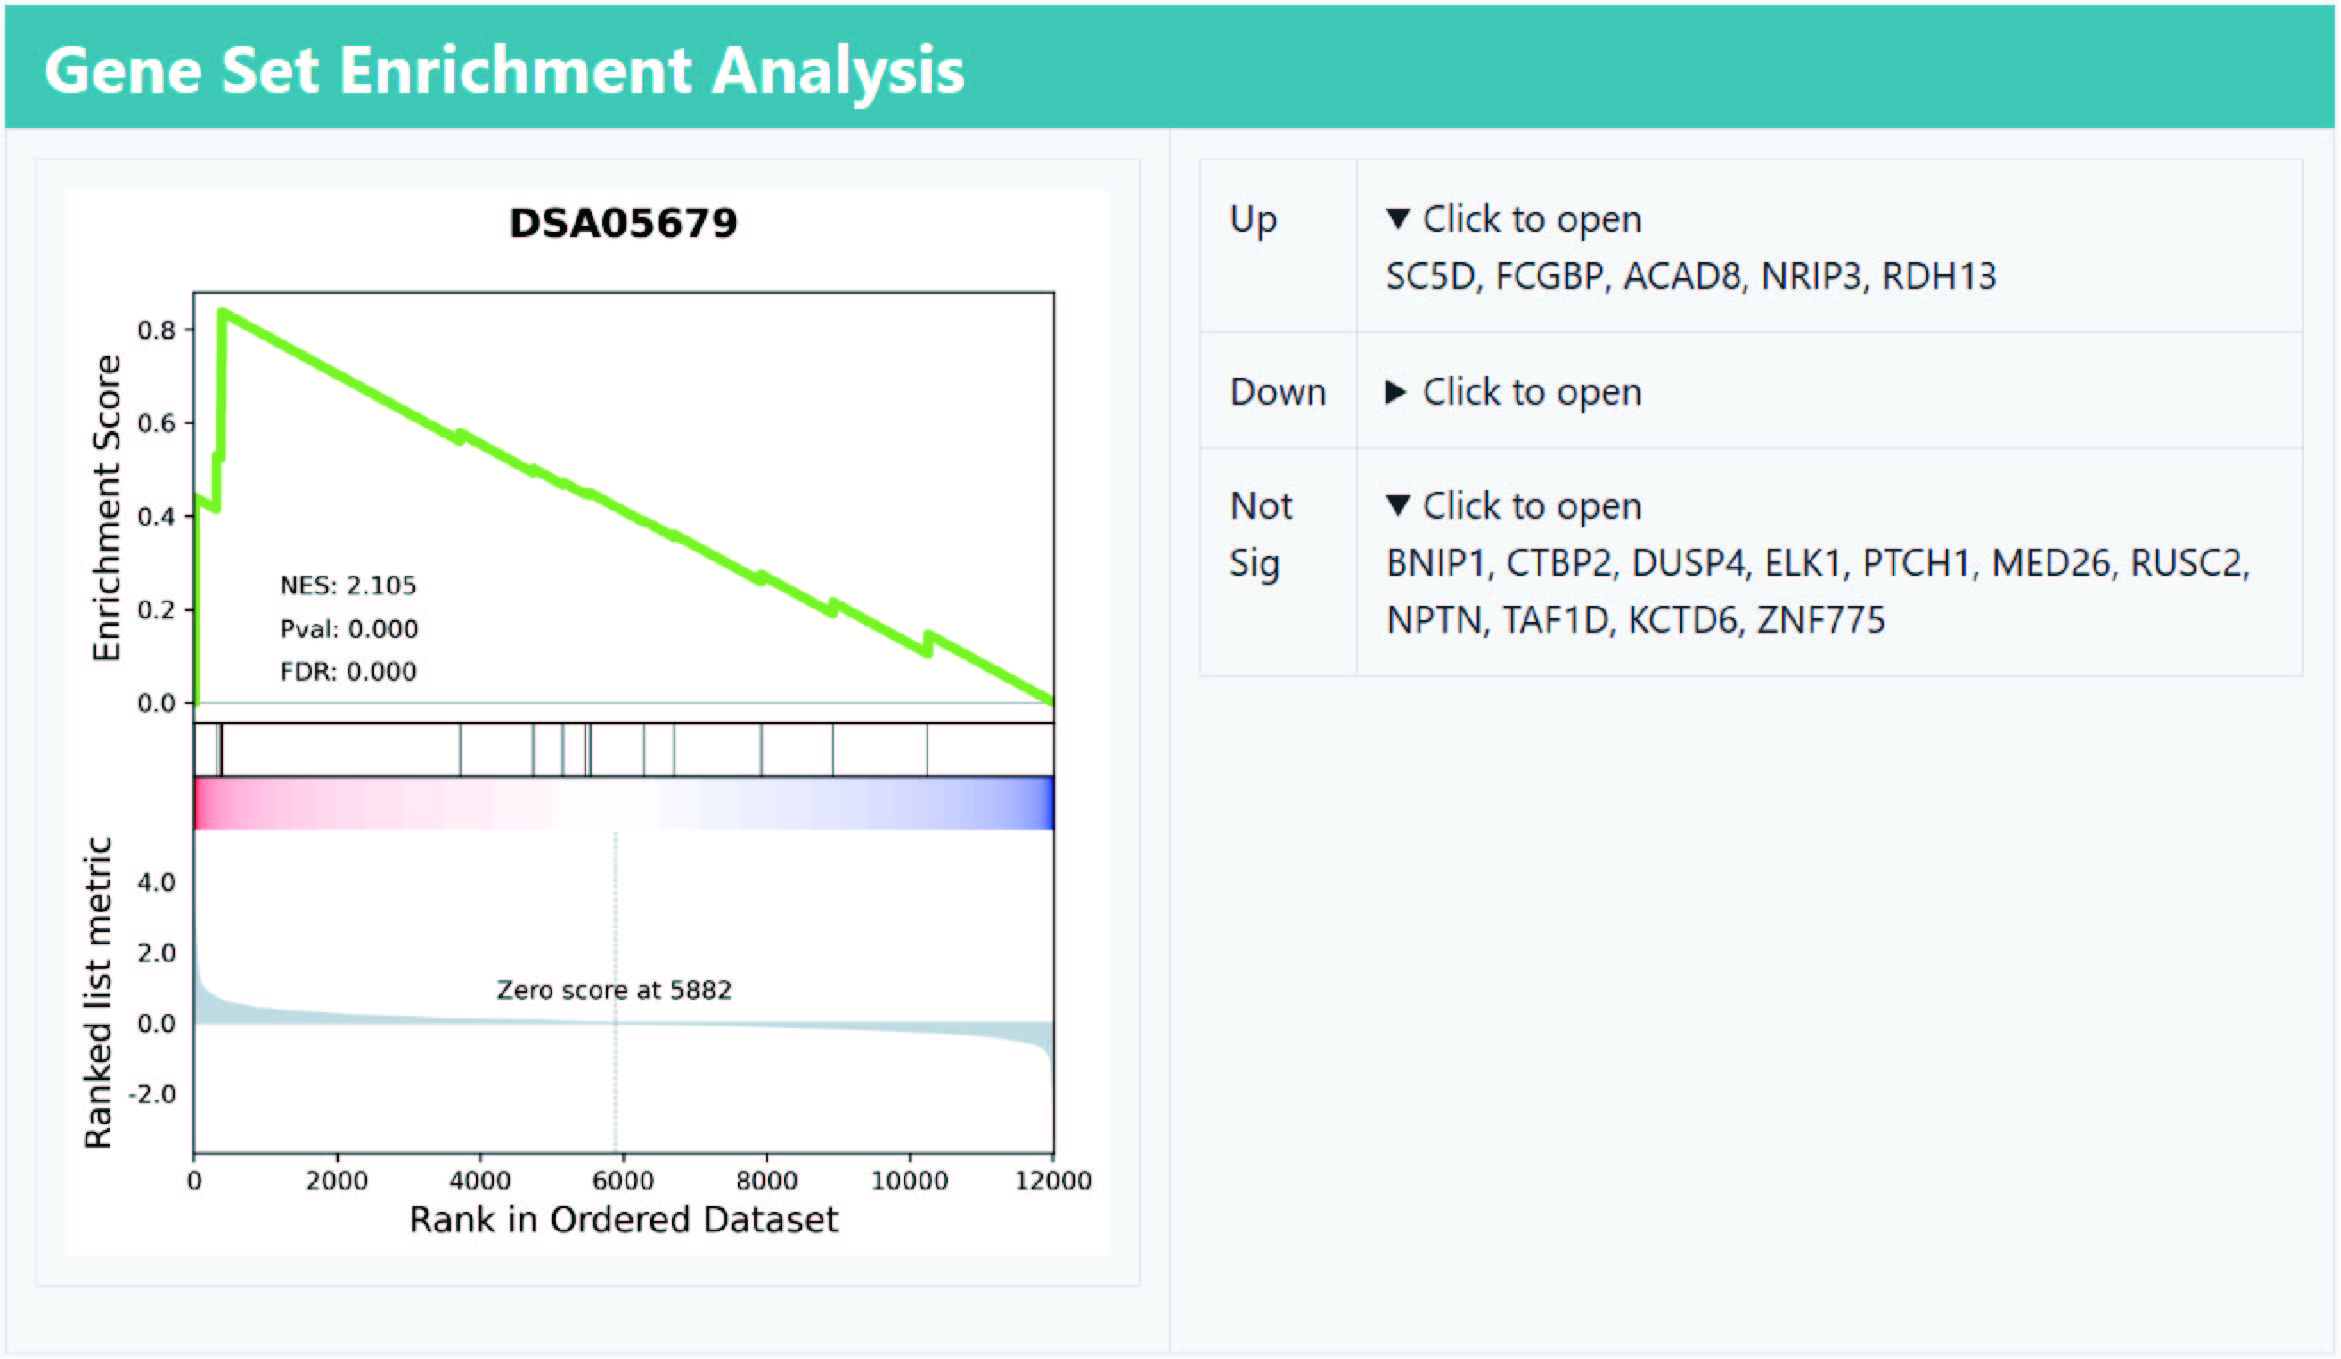
As the results, the DiSignAtlas datasets in which user submitted genes are over-represented are given. Enrichment scores are provided for each dataset.
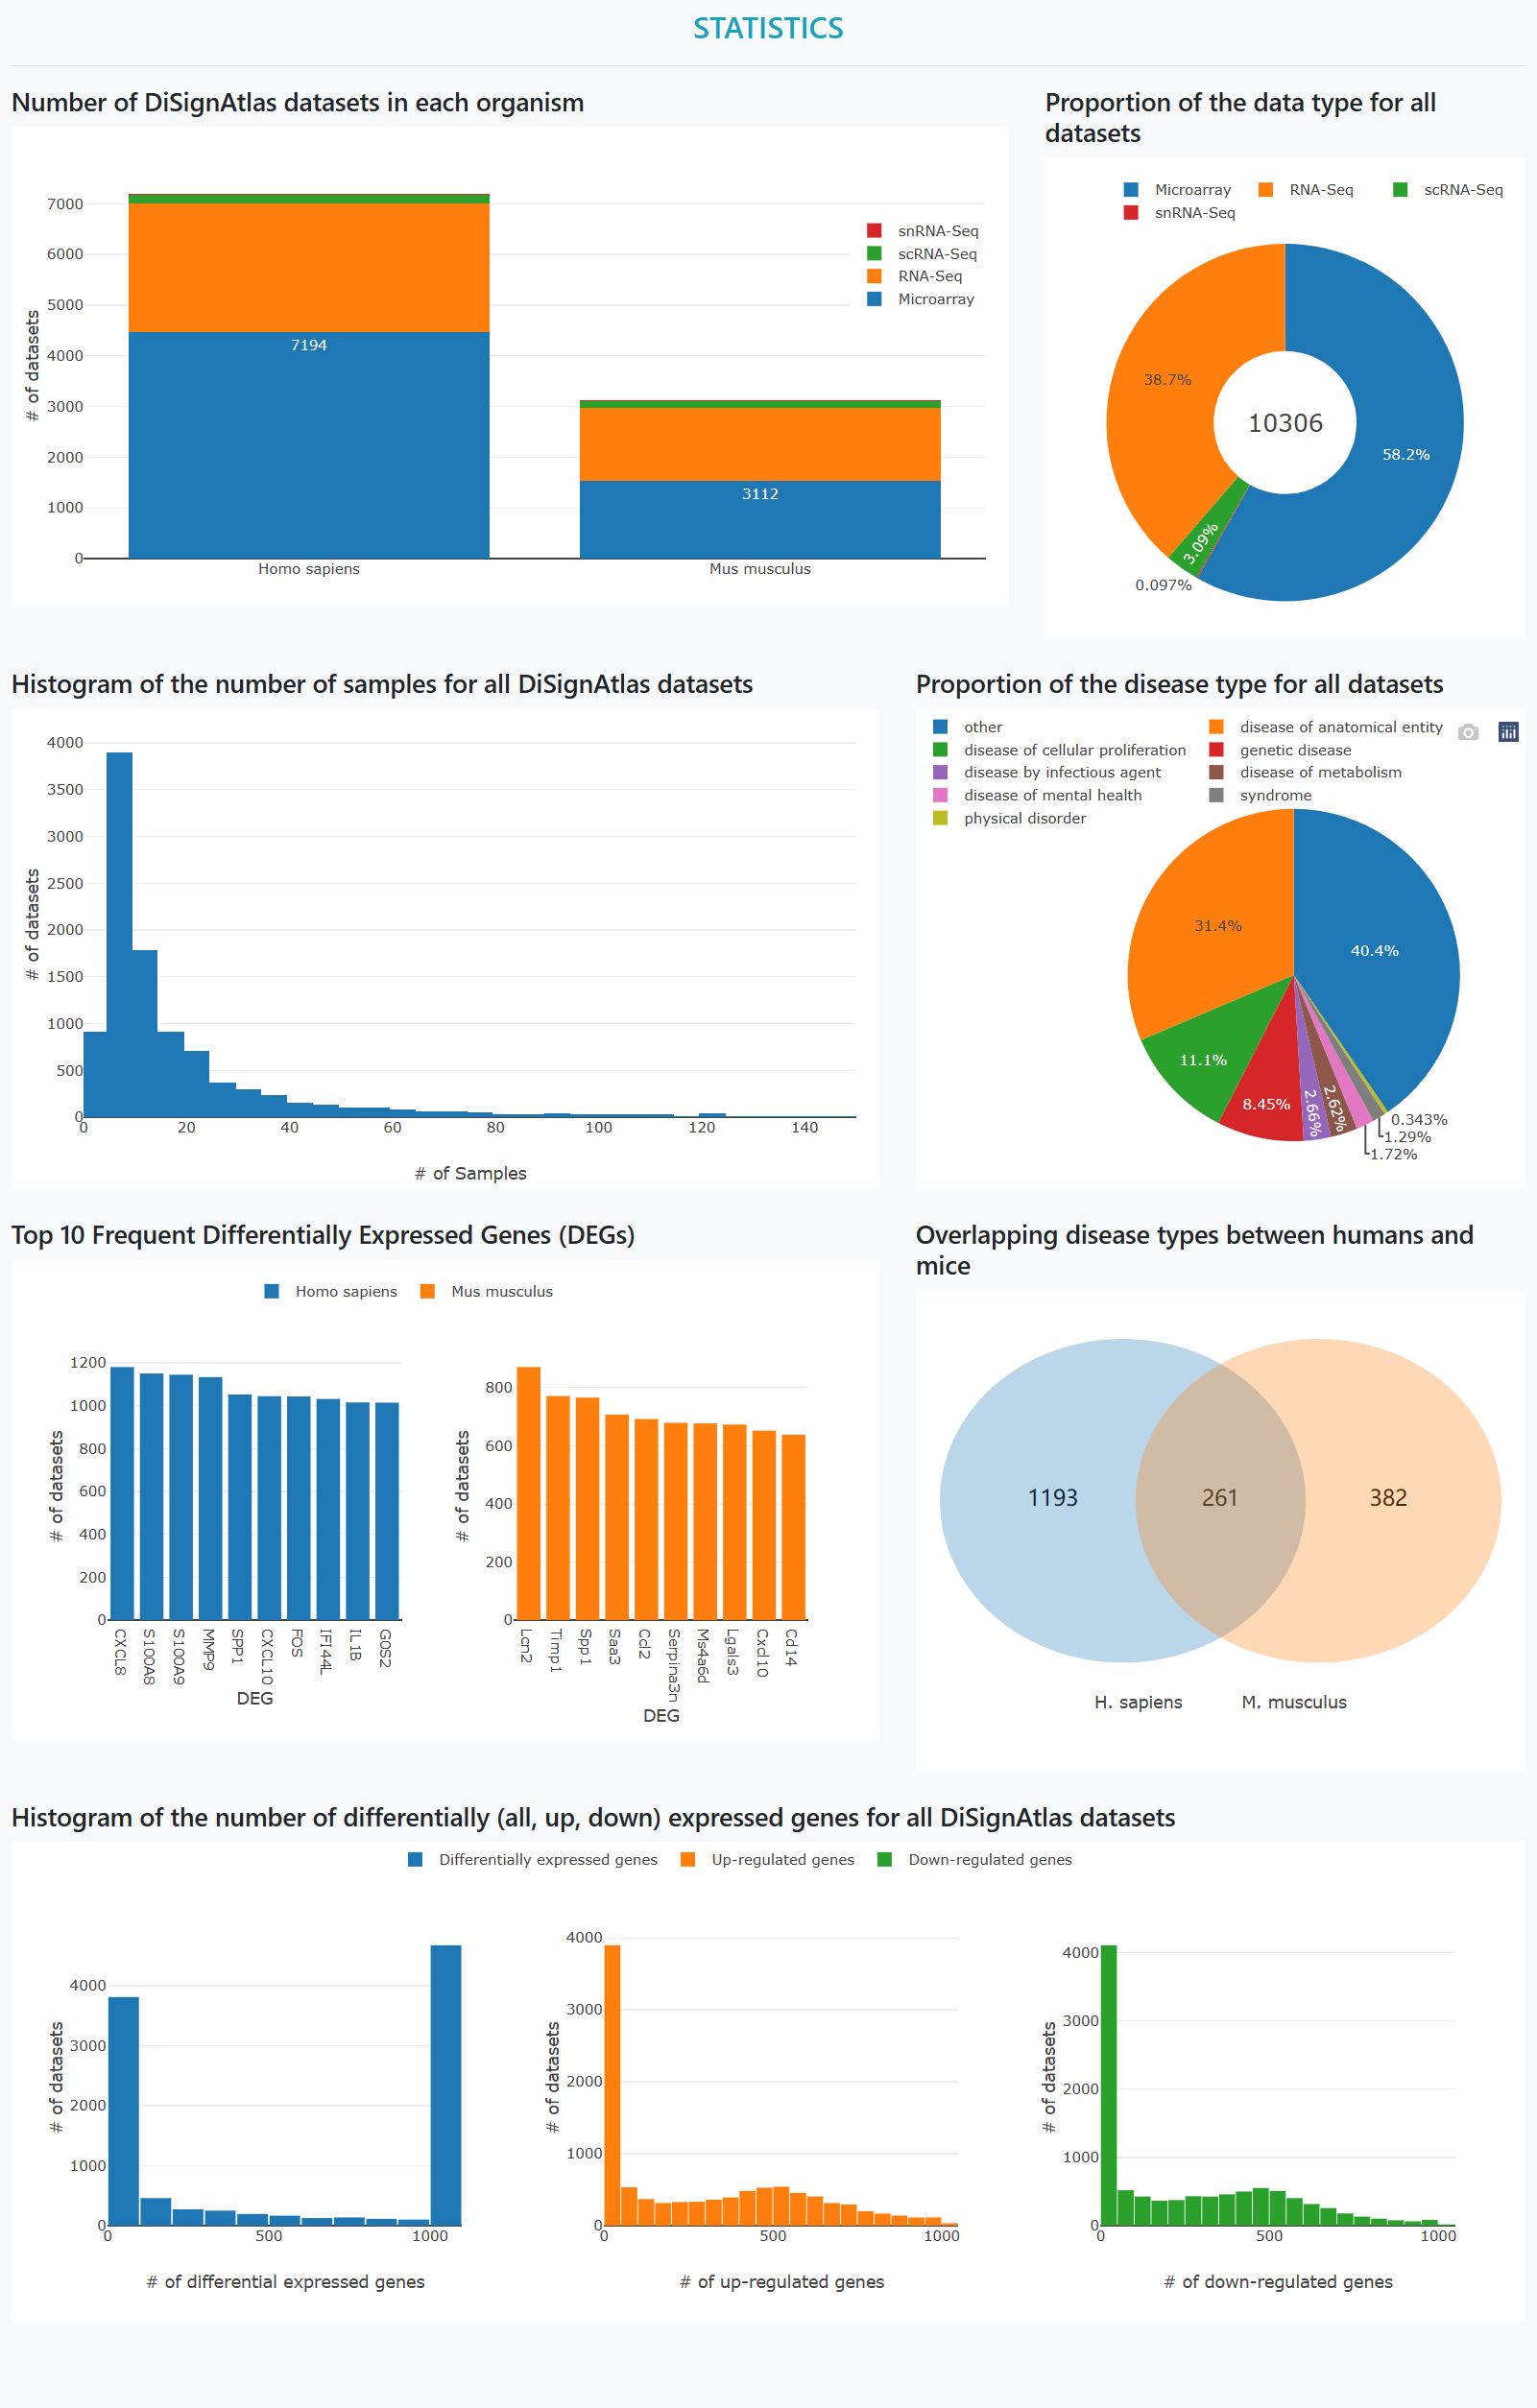
In the "Statistics" page, the statistics of the disease datasets in multiple perspectives are illustrated.
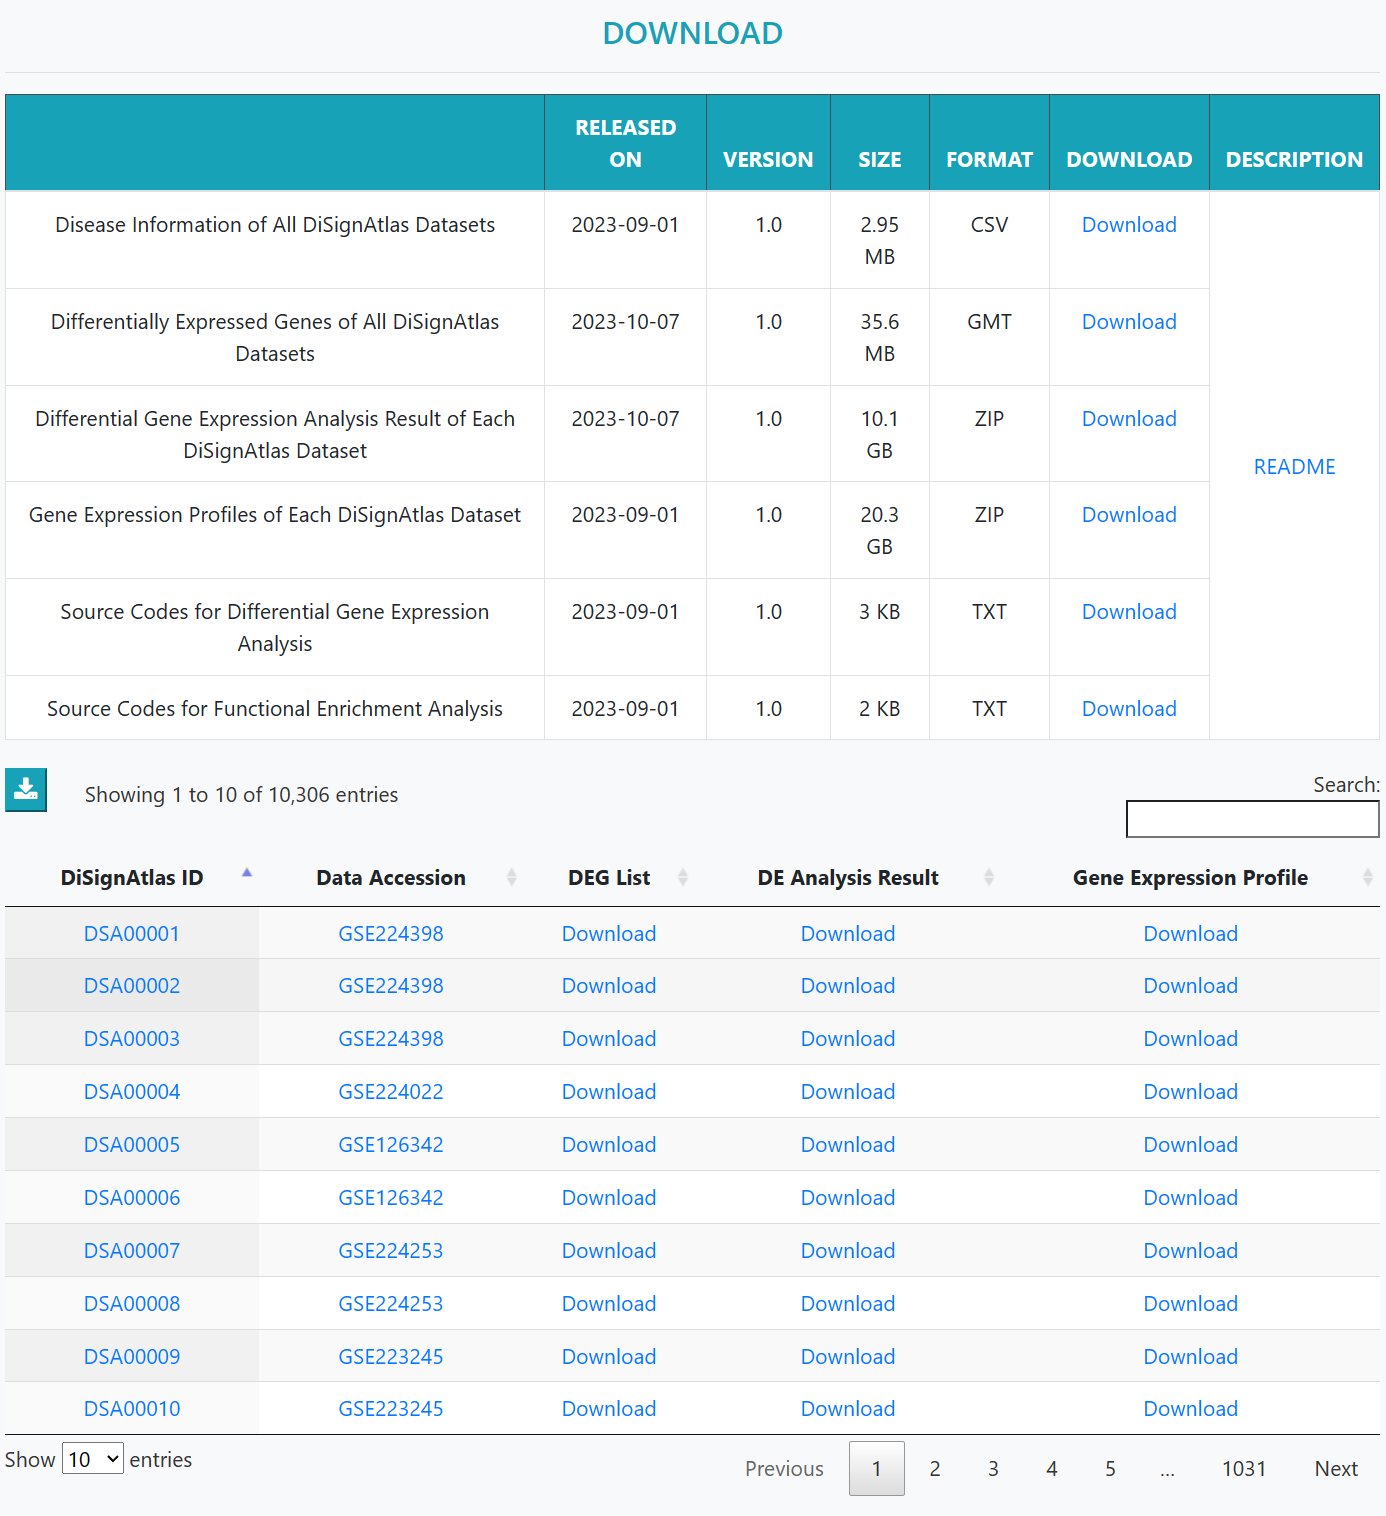
In the Download page, the information of disease datasets, available DEGs, differential gene expression analysis result and gene expression profiles of each DiSignAtlas dataset can be downloaded.
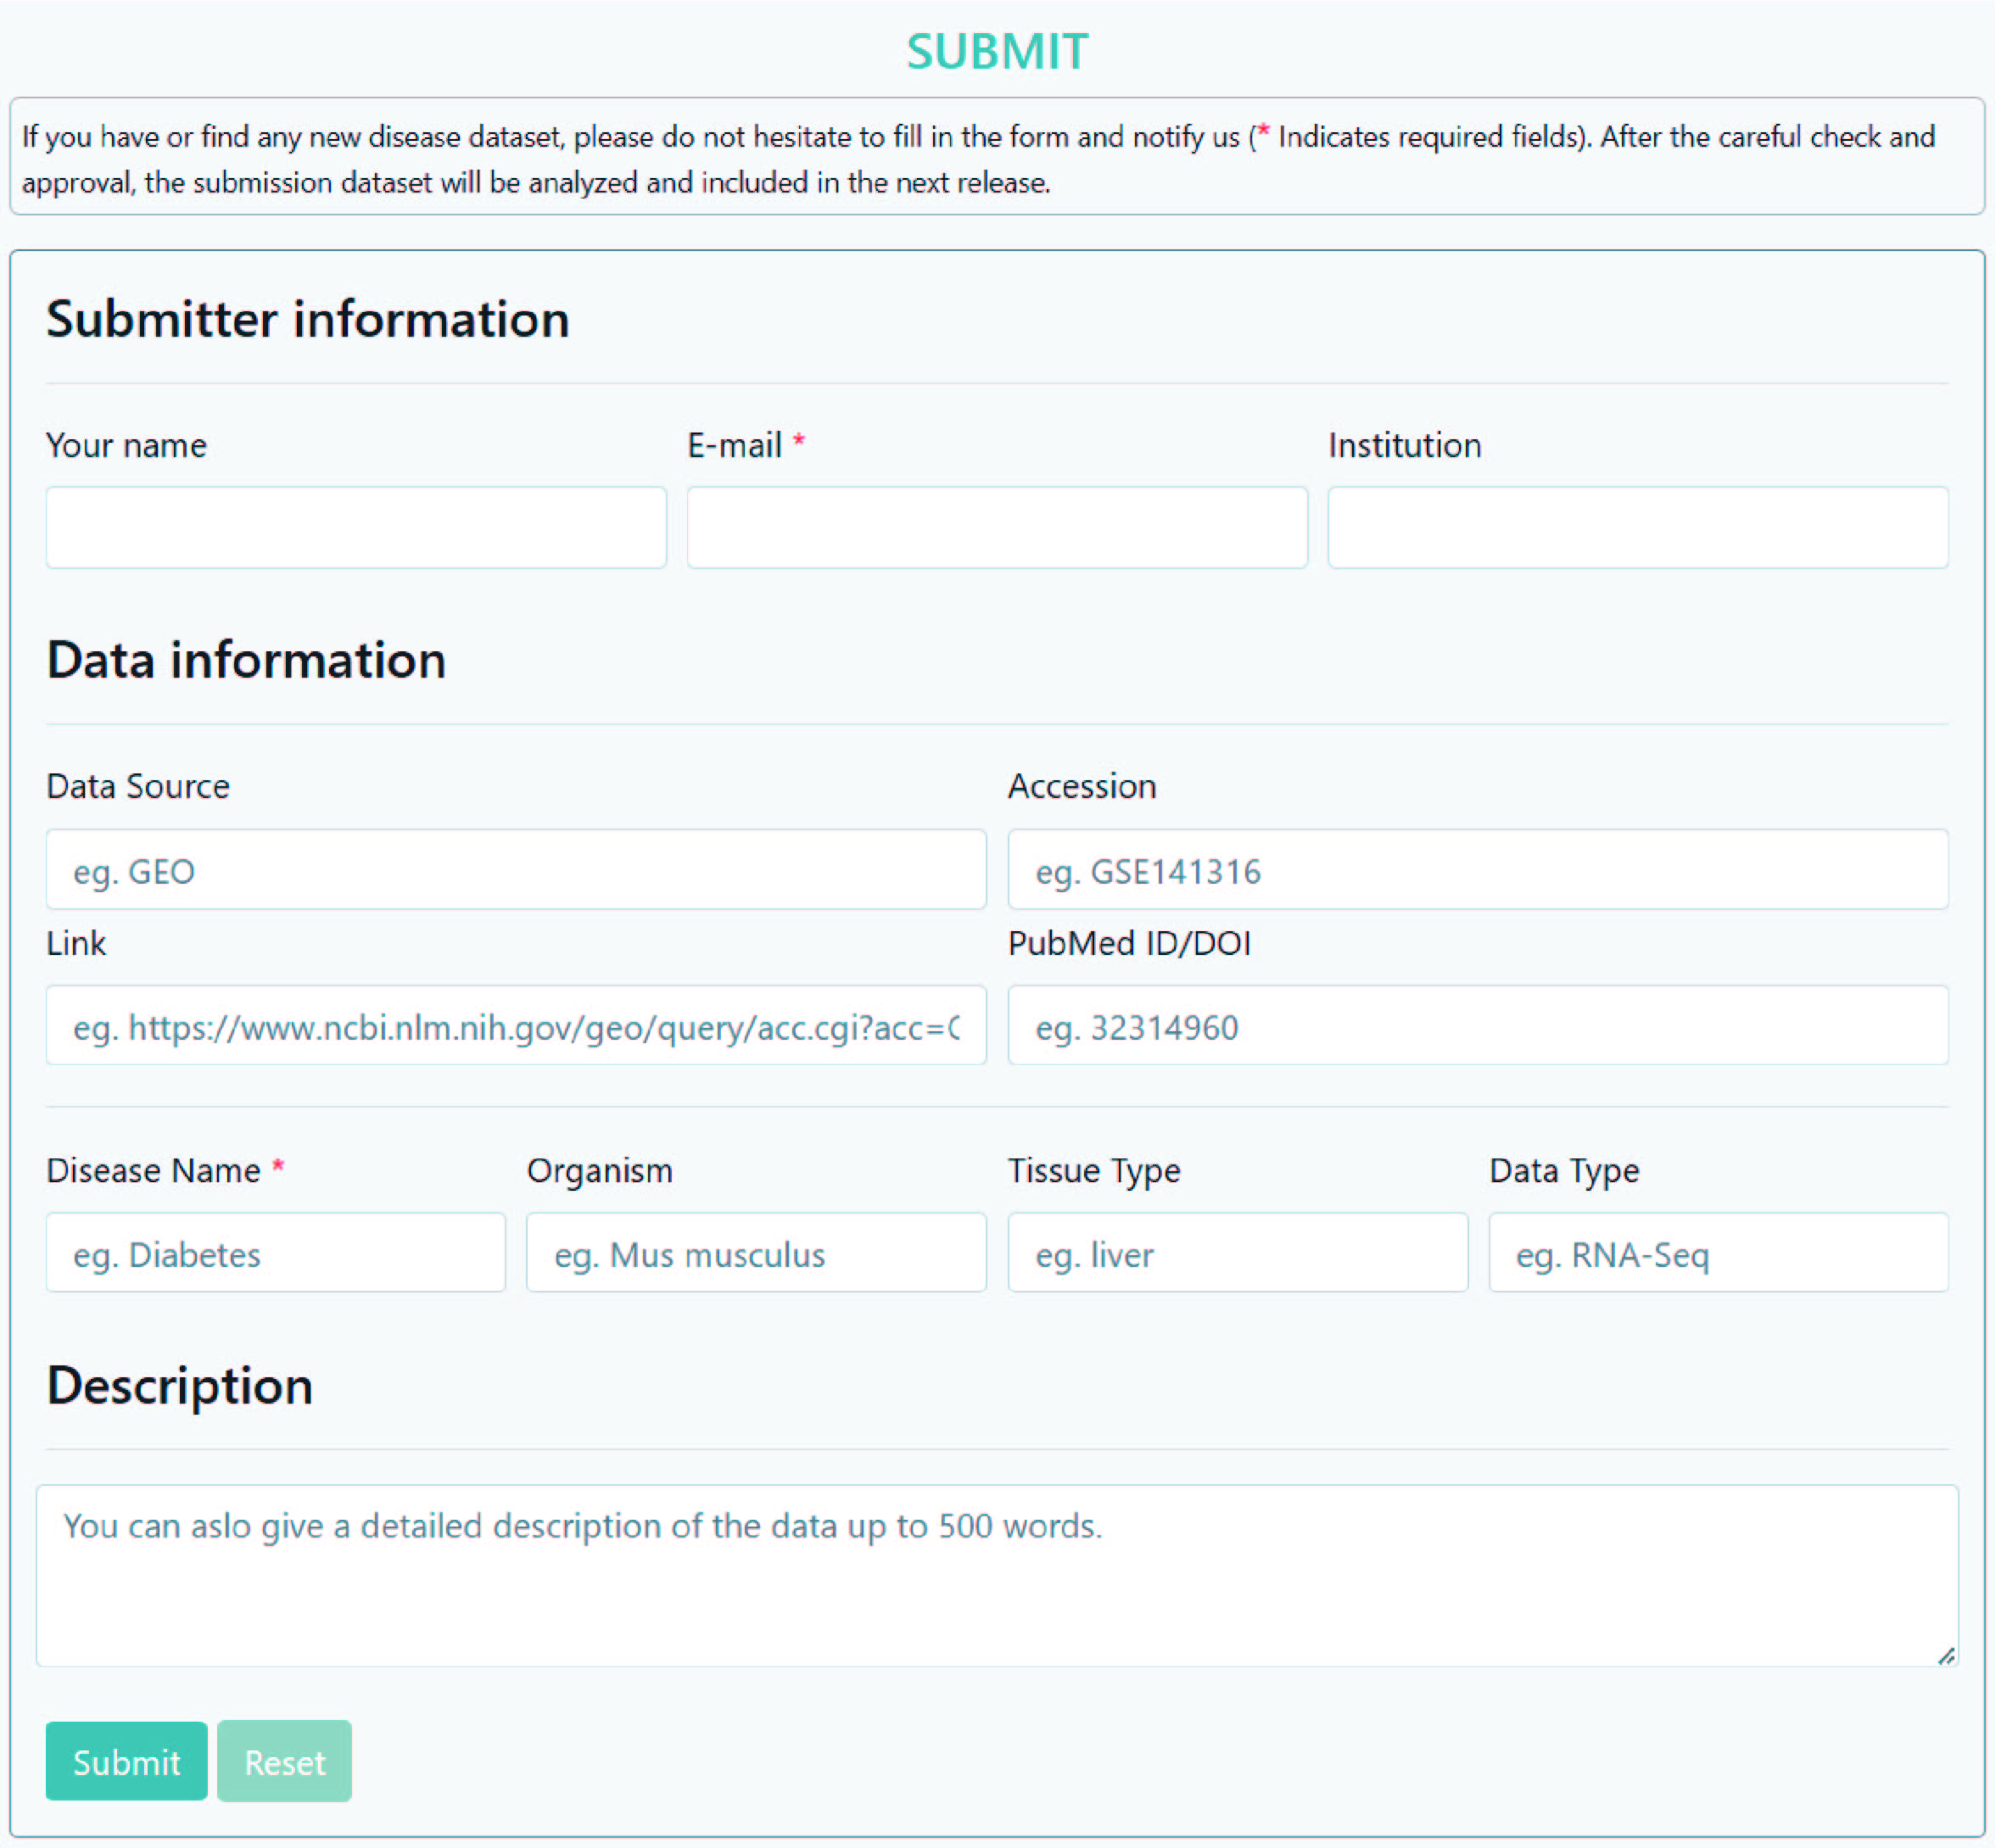
Although an increasing number of disease datasets are expected to be collected, many available datasets could still be missed. Therefore, users are encouraged to submit their dataset that meets DiSignAtlas criteria for future integration. DiSignAtlas allows users to submit disease names, tissue types, data types and organisms, as well as a link to their data sources on the "Submit" page. Once the submission is received, data will be carefully evaluated and further processed using our standard procedures in DiSignAtlas, as described in the Material and Methods section. Finally, the dataset and the corresponding analysis results will be included in the future release of DiSignAtlas.
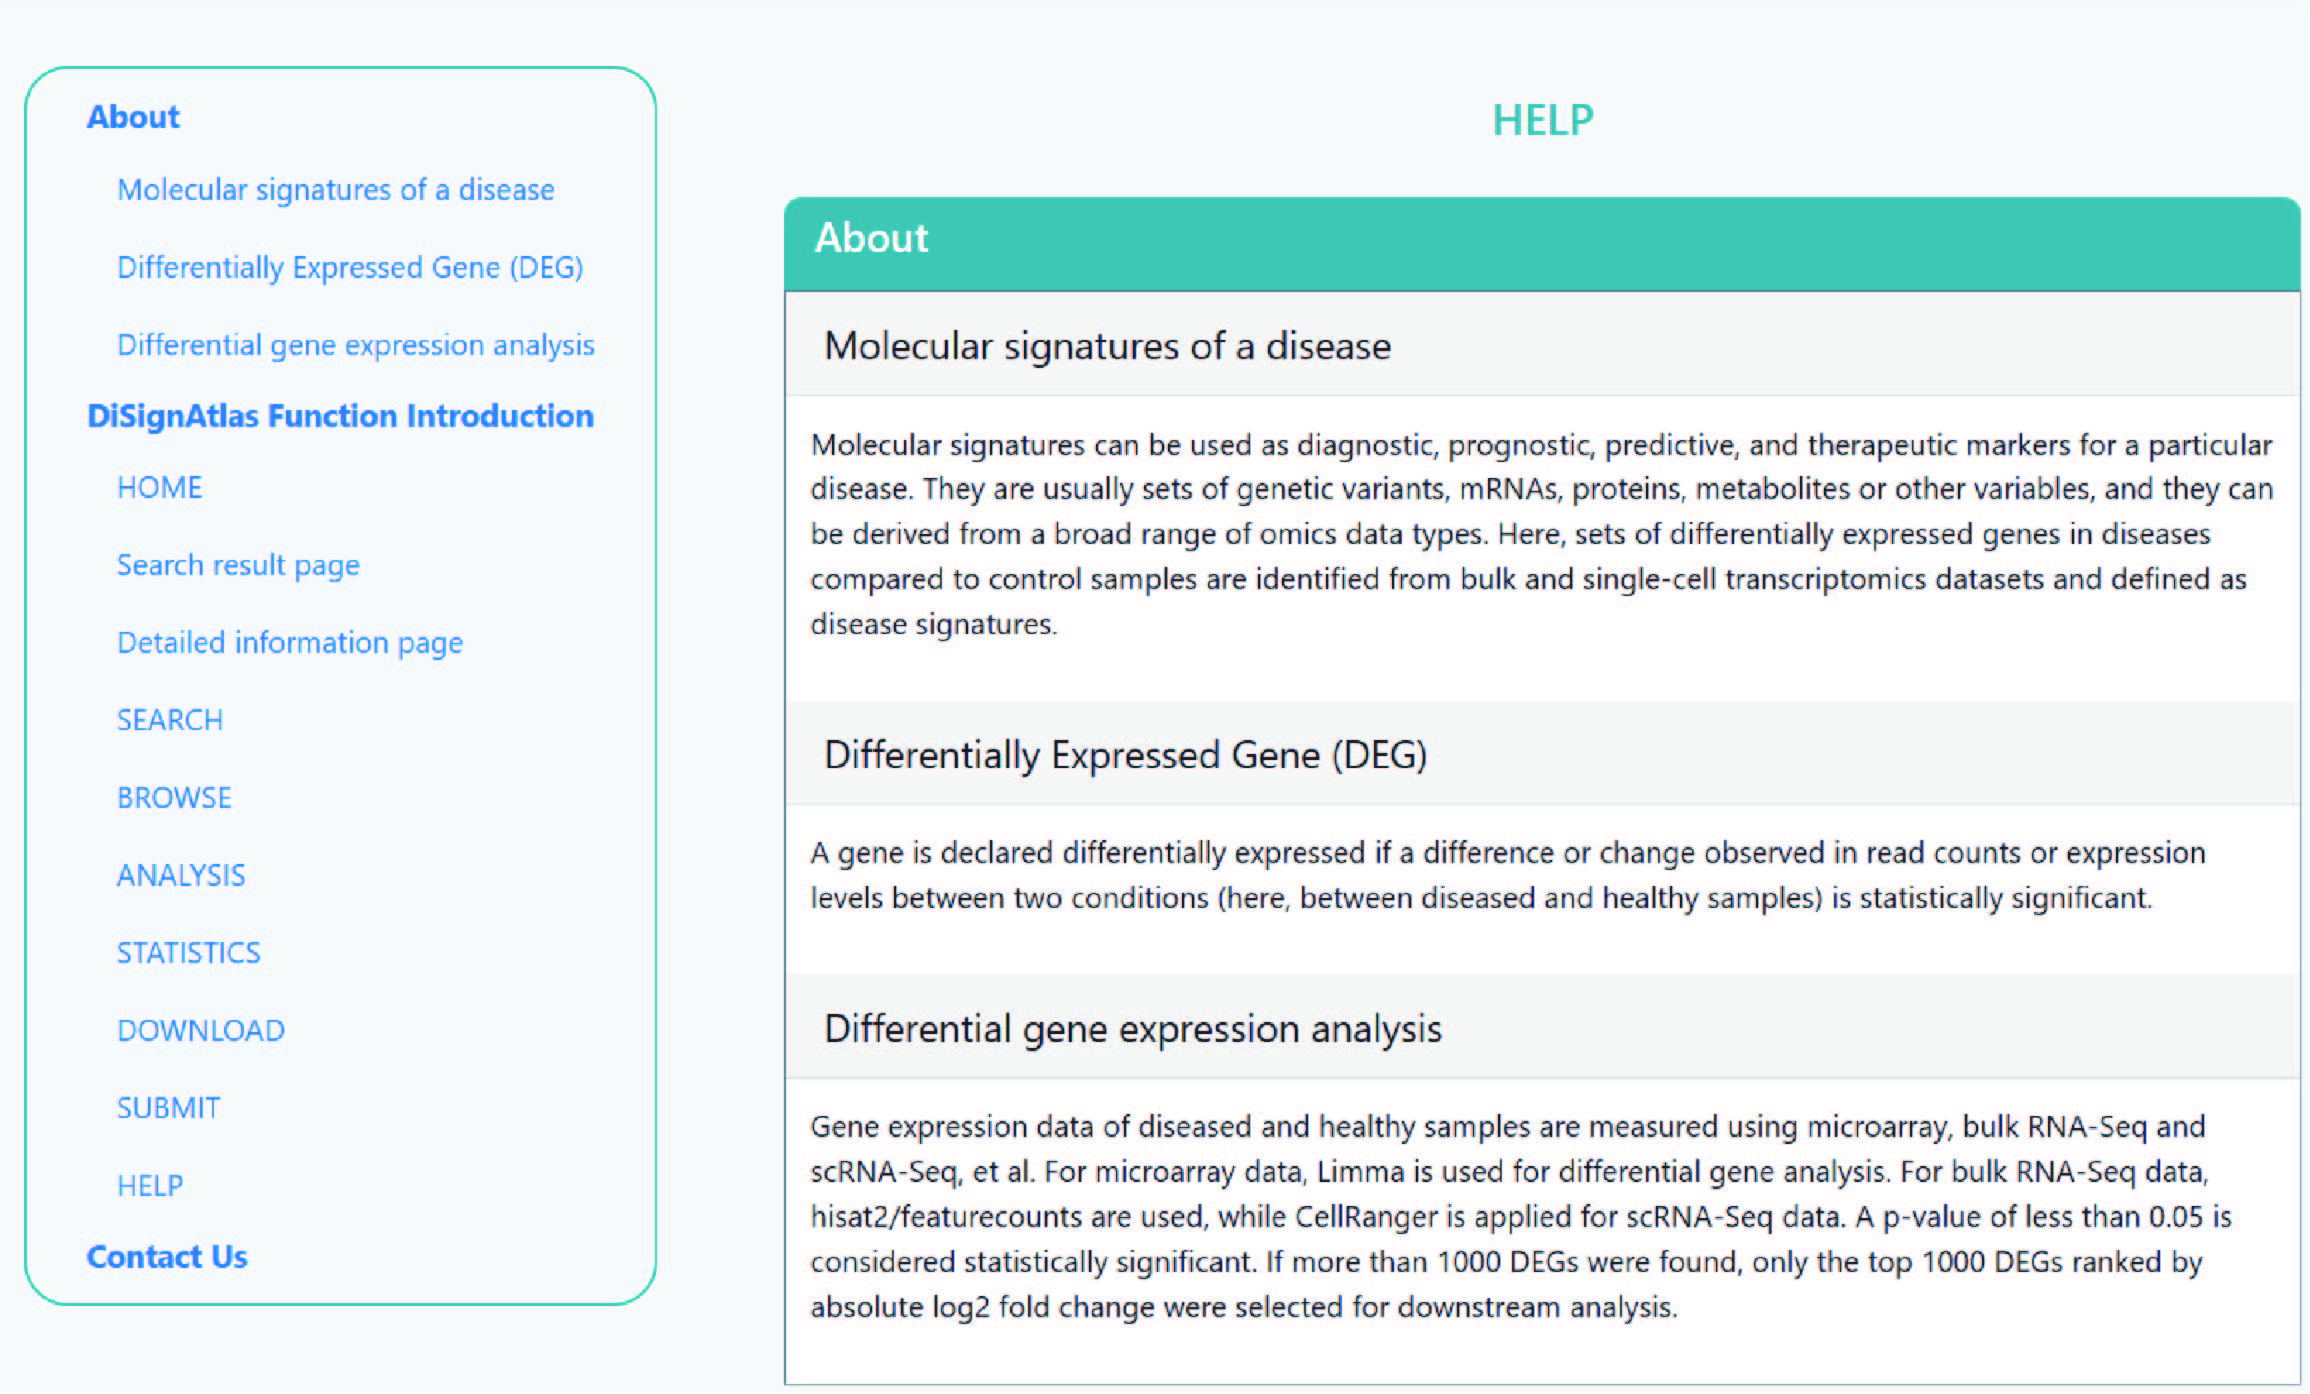
On the help page, the introduction of the features and the guidelines for the functions are stated. The contact details are attached at the bottom.
- Please feel free to contact Prof. Jianbo Pan with respect to any details pertaining to DiSignAtlas.
-
>Address :
Center for Novel Target and Therapeutic Intervention, Institute of Life Sciences, Chongqing Medical University,
No. 1 Yixueyuan Road, Yuzhong District, Chongqing, 400016, P. R. China.
-
>Email :
panjianbo@cqmu.edu.cn