Introduction
Welcome to CellCommuNet, an atlas of cell–cell communication networks from human and mouse tissues in normal and disease states. We analysed single-cell RNA sequencing data through CellChat and CellPhoneDB to explore the mechanisms and processes of cell‒cell communication, and presented the results on this user-friendly web application.
Cell‒cell communication, a fundamental feature of multicellular organisms, enables cells to exchange information, coordinate behaviors, and respond to their environment in a highly synchronised manner. This intricate system is essential for maintaining the biological functions and microenvironmental homeostasis of cells, organs and complete systems.
CellCommuNet serves as a gateway to unlock the mysteries of cell‒cell communication, providing an in-depth exploration of the communication strengths, signalling pathways, ligand‒receptor pairs and cell types of cells in various tissues or diseases. We have manually collected and curated 376 scRNAseq datasets from multiple existing single cell databases (i.e., CancerSCEM, SCEA, CancerSEA and GEO), involving over 4,300,000 cells and 397 cell types. We analysed not only cell‒cell communication networks in these datasets, but also differences in communication of 118 comparison datasets between disease and control samples from the same scRNA-seq study. These results were carefully curated and organised into CellCommuNet for effortless navigation.
As the exploration of cell‒cell communication continues to advance, we will continue updating CellCommuNet. We look forward to your use and comments to improve CellCommuNet!
Functions
Pathway Search
The “pathway” mode provides a pathway-based search. Users can narrow their search to studies of interest by refining the selection box with keywords and finally search for pathways to see which studies have cellular communication mediated through that pathway.
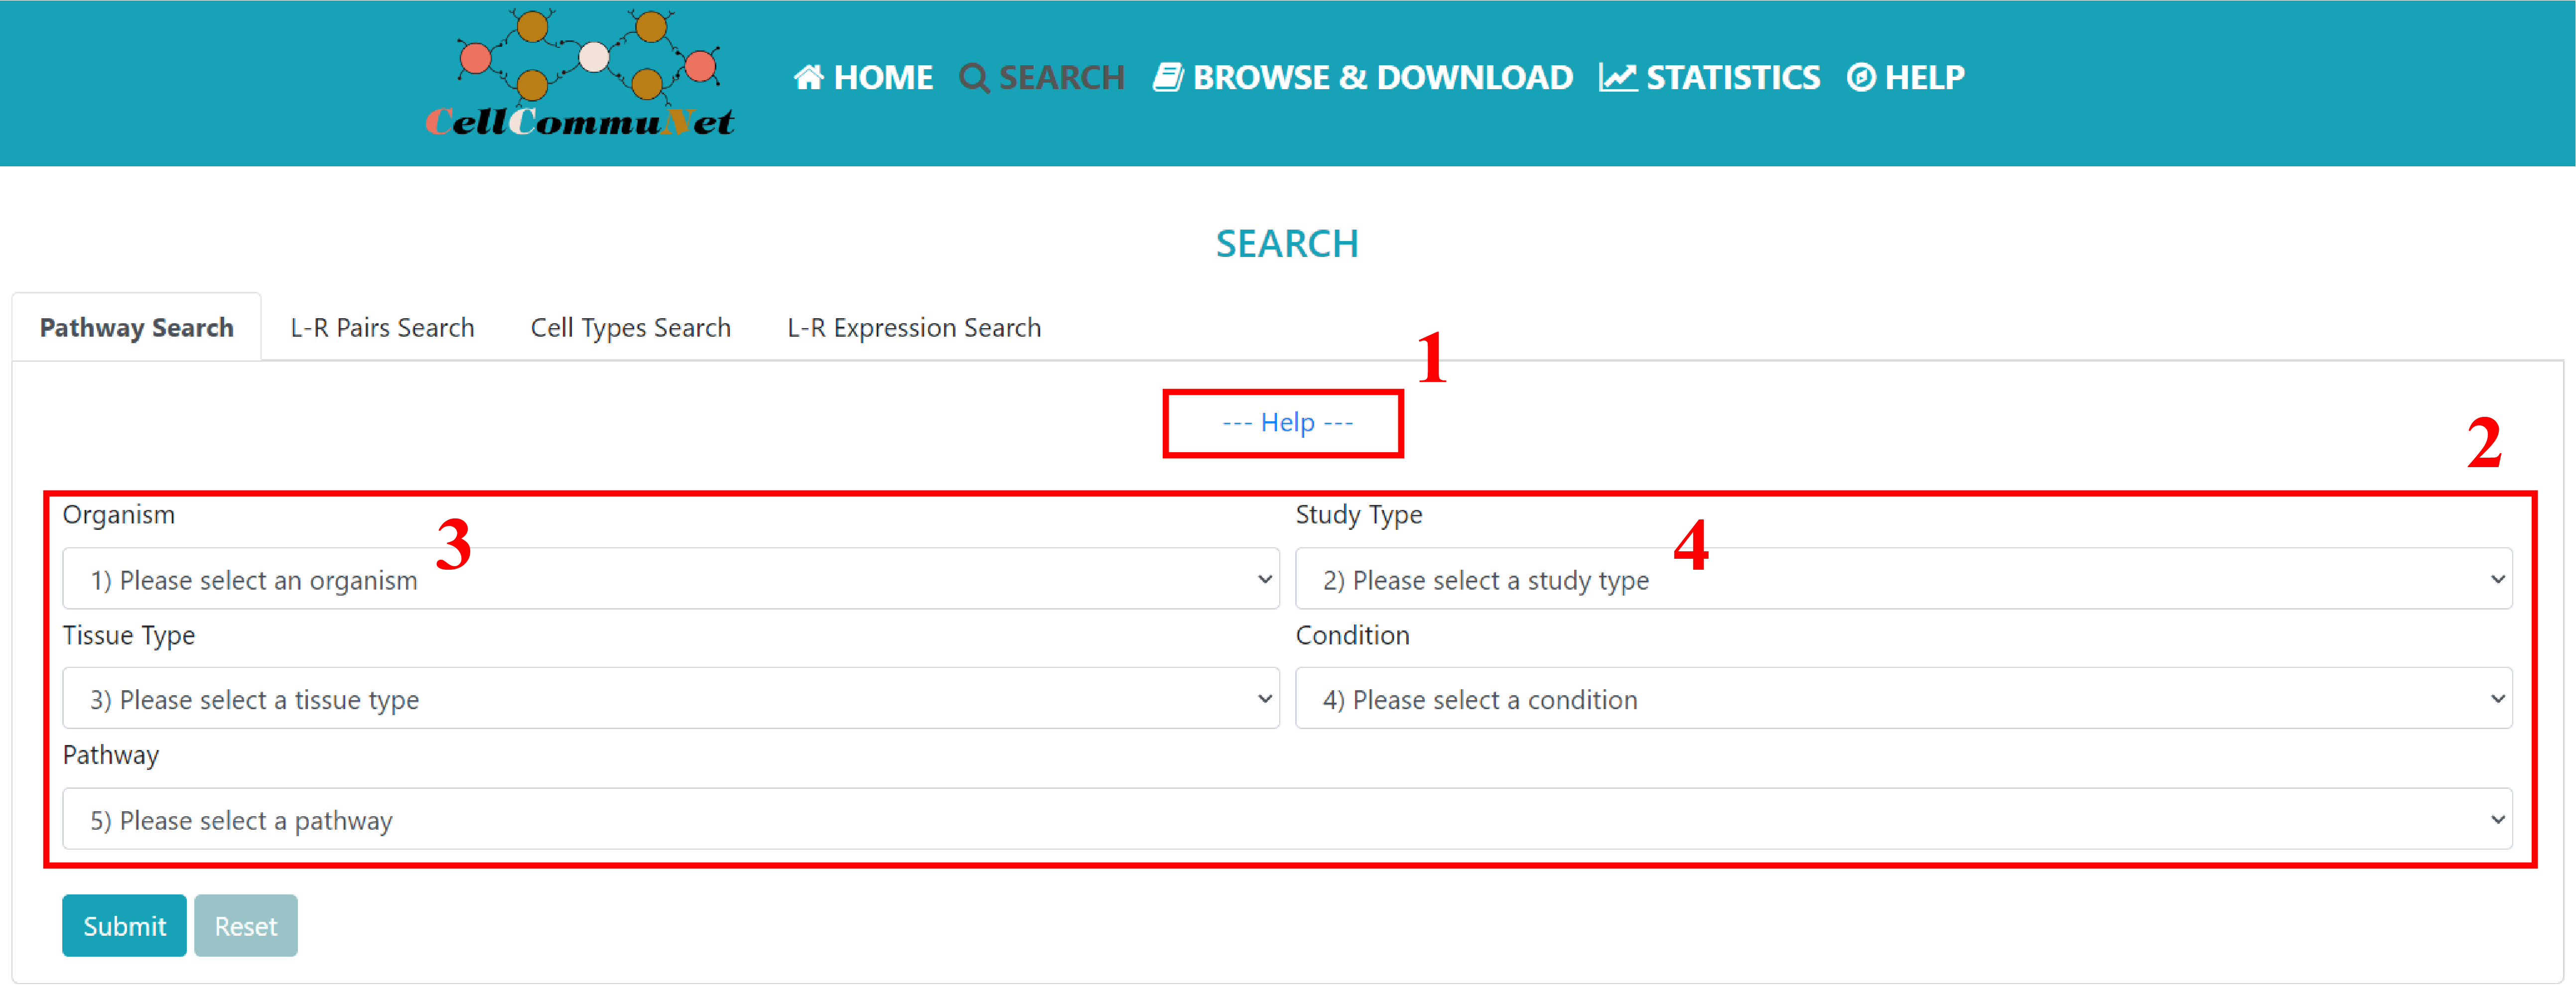
1) The expandable help section under each mode describes basic information about the module. 2) Under the selection box, you will need to choose the relevant option according to your field of study. Of course, 3) you can also see all the results of the relevant options by selecting the first element of the drop-down box such as 'all organism', 4) except for the 'Study Types' which must be selected from Single and Comparison.
Results
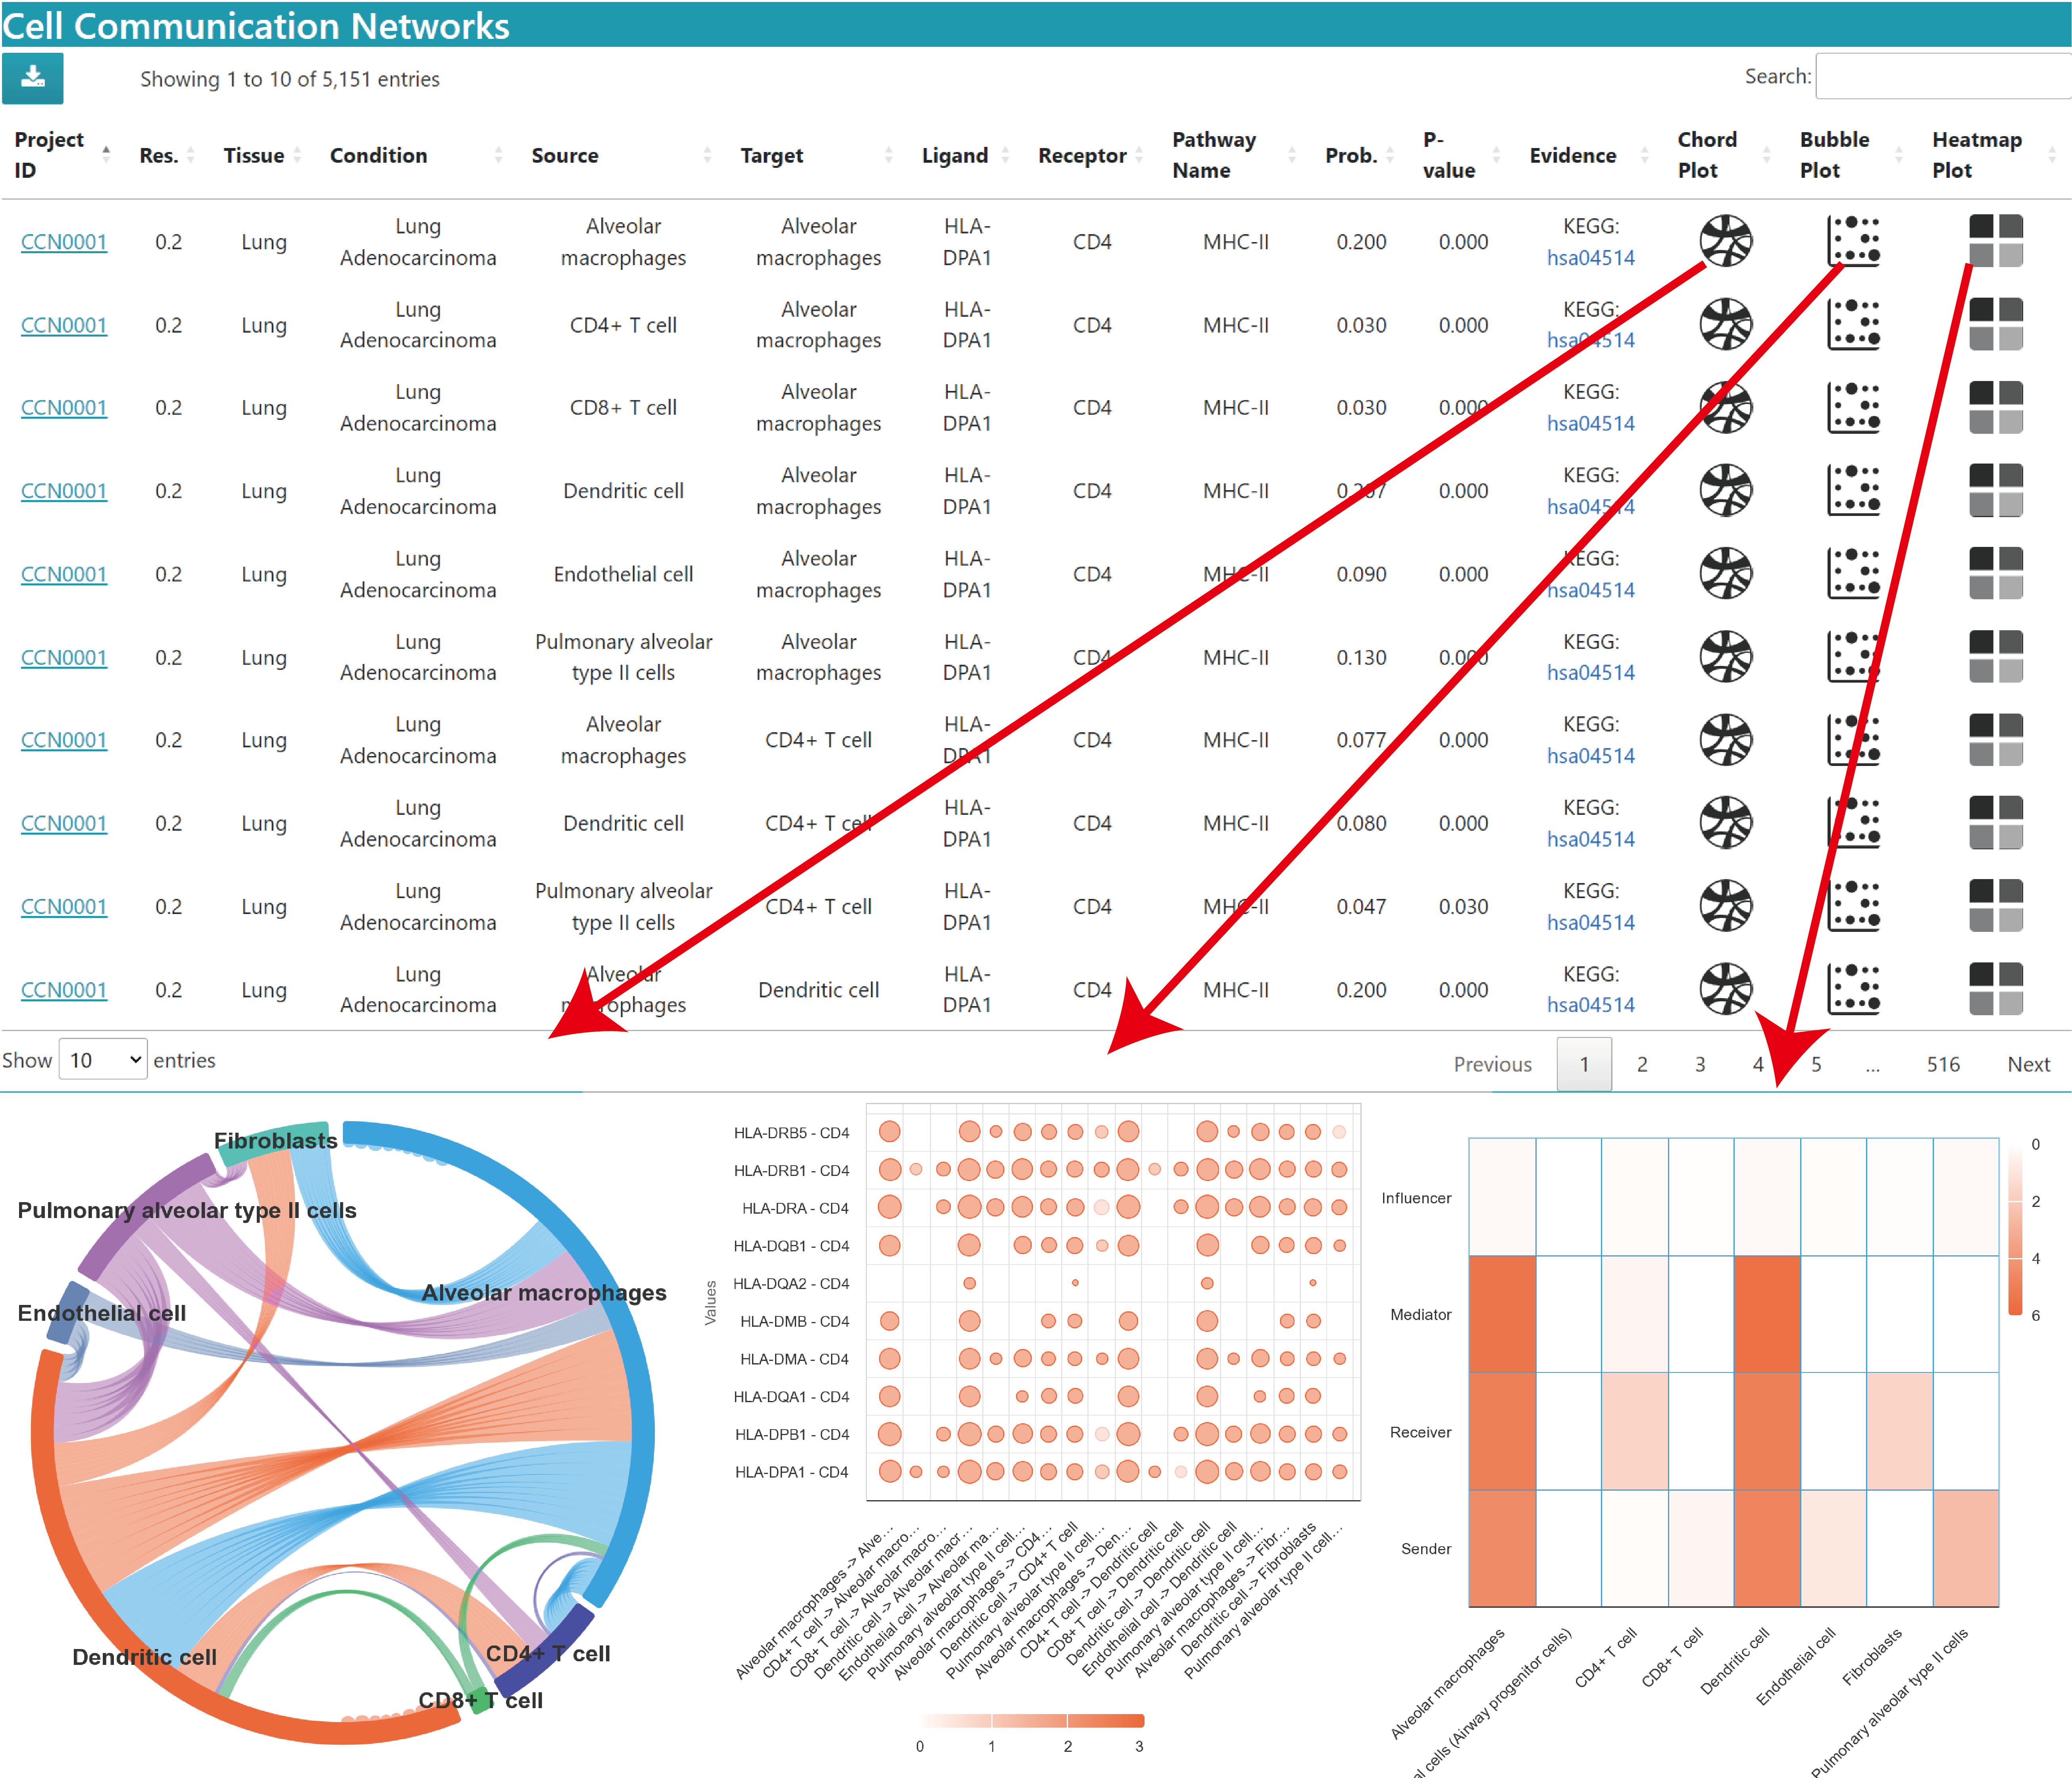
In the Single dataset result, you can view the related cell‒cell communication result for your searched pathway
Project ID: The project ID of the search result, click on the link to jump to the detail page of the dataset.
Res.: The resolution of the single cell clustering, and different resolutions affect the result of cell annotation.
Tissue: The basic information about the tissue of the dataset to which the current communication term.
Condition: The basic information about the condition(disease or normal) of the dataset to which the current communication term.
Source: Cell types that send signals.
Target: Cell types that receive signals.
Ligand: Gene encoding a ligand in the source cell.
Receptor: Gene encoding a receptor in the target cell.
Pathway Name: The pathway that mediates this communication.
Prob.: The probability(strength) of this communication.
P-value: The significance level of the results.
Evidence: References that support the occurrence of communication for this ligand‒receptor pair.
Chord Plot: Total communication strength chord plot of this pathway in the current dataset.
Bubble Plot: Bubble plot of the probability of each communication through this pathway in the current dataset. The horizontal axis is the source cell to target cell and the vertical axis is the ligand‒receptor pair. Bubble size is the probability value, and color represents significance, 3 means p value < 0.01, 2 means 0.01 < p value < 0.05, 1 means p value > 0.05.
Heatmap Plot: The heatmap shows the main roles (Sender, Receiver, Mediator, Influencer) of cells in the communication mediated by this pathway in the current study.
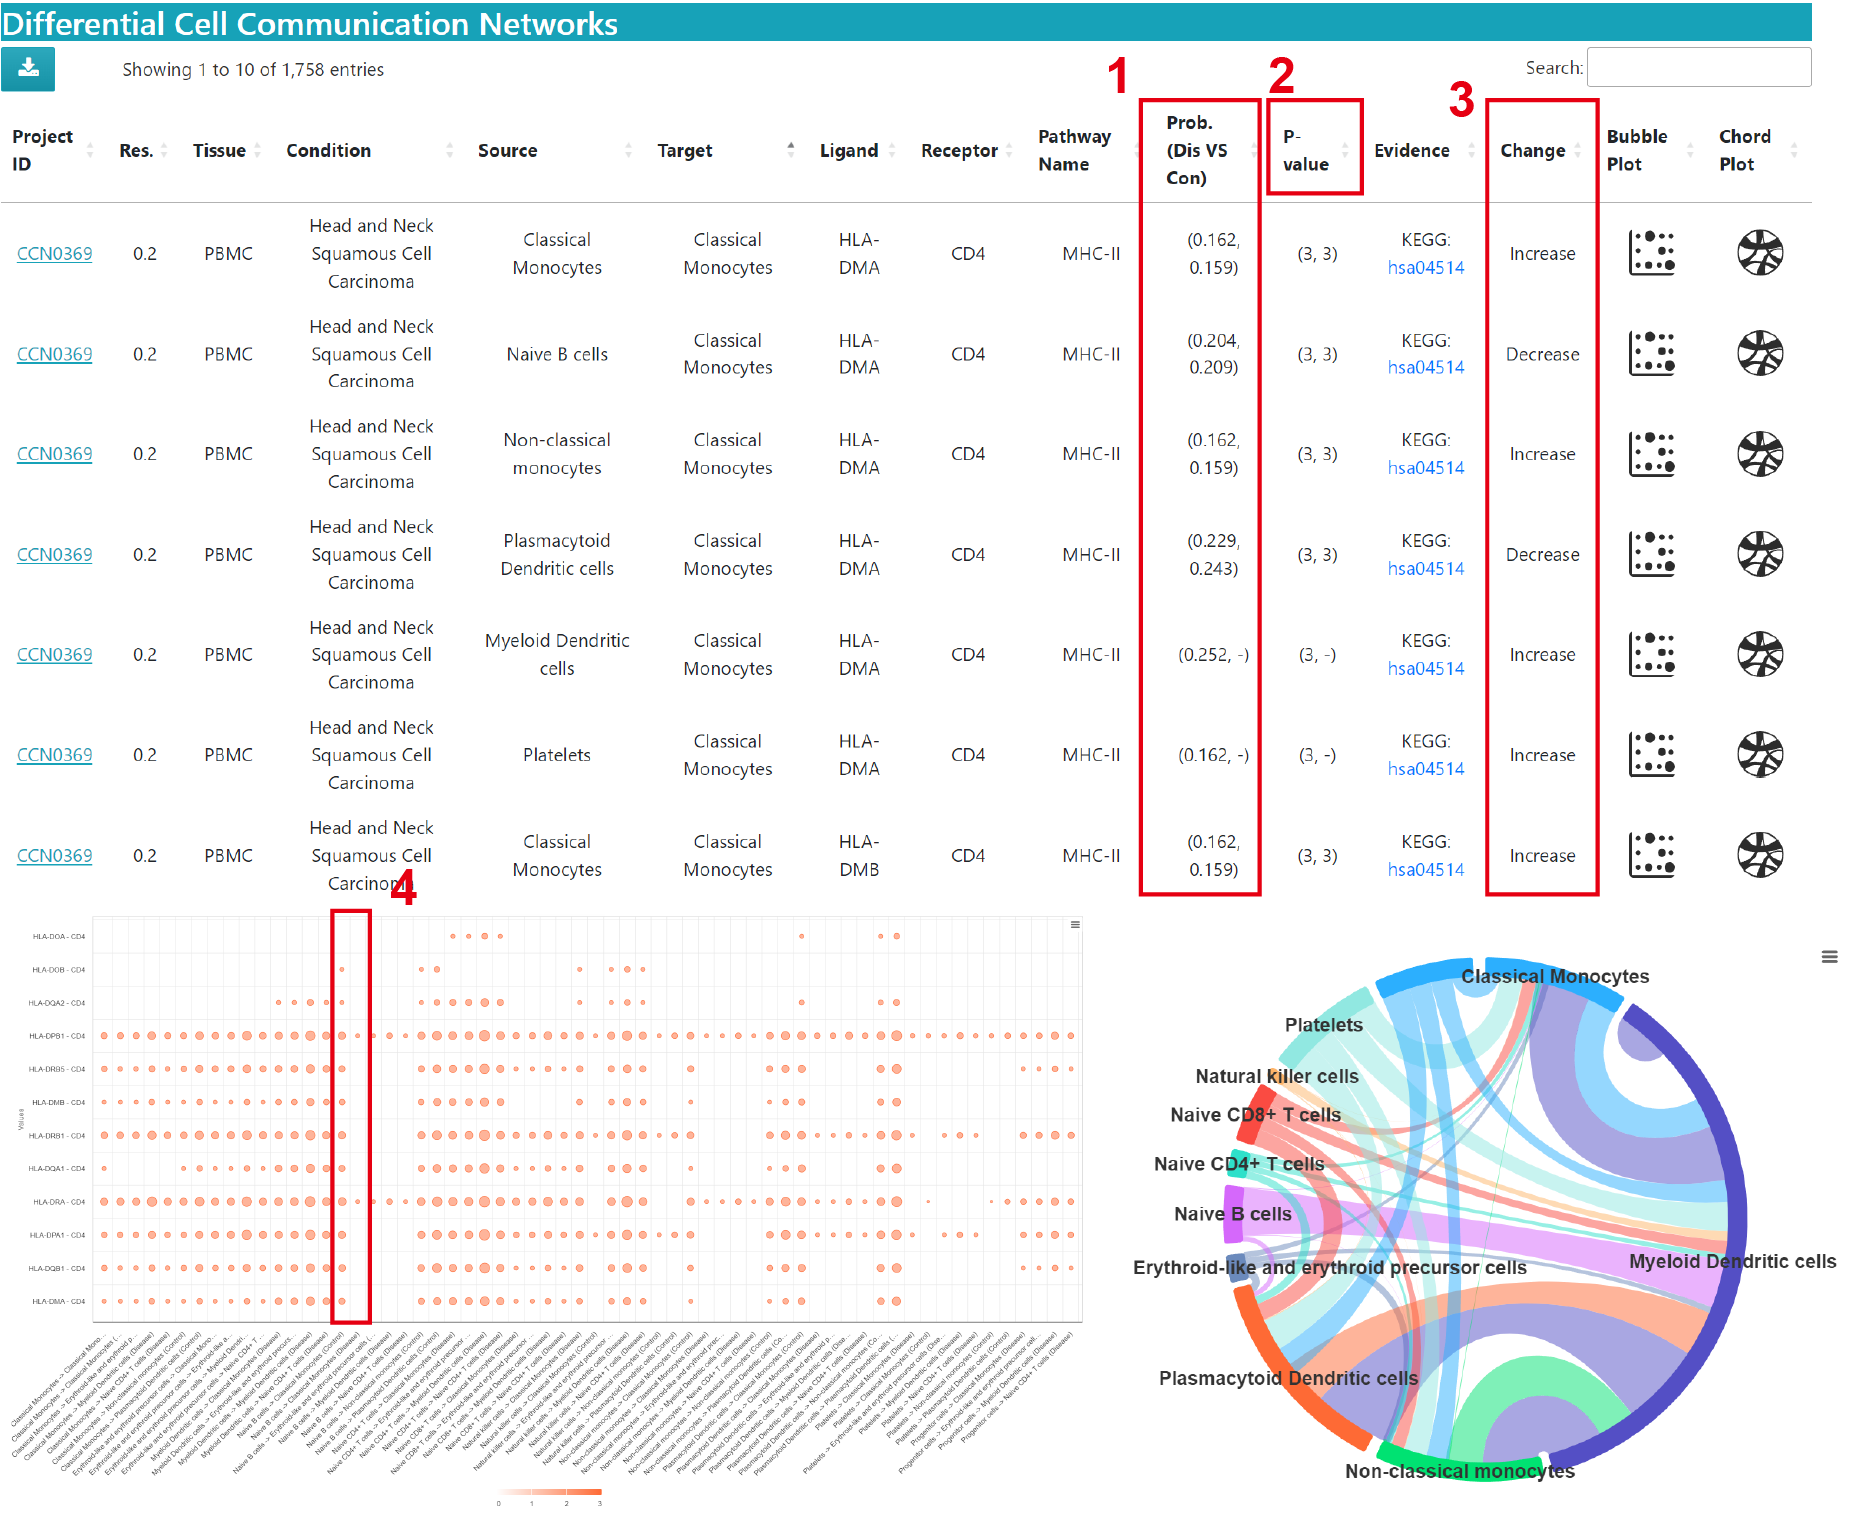
In the Comparison dataset result, you can view the differences in cell communication in diseased and normal samples
Project ID: The project ID of the search result, click on the link to jump to the detail page of the dataset.
Res.: The resolution of the single cell clustering, and different resolutions affect the result of cell annotation.
Tissue: The basic information about the tissue of the dataset to which the current communication term.
Condition: The basic information about the condition(disease or normal) of the dataset to which the current communication term.
Source: Cell types that send signals.
Target: Cell types that receive signals.
Ligand: Gene encoding a ligand in the source cell.
Receptor: Gene encoding a receptor in the target cell.
Pathway Name: The pathway that mediates this communication.
1) Prob. (Dis VS Con): Comparison of communication strength in disease (Dis) and normal (Con). "-" means the current communication is missing in the corresponding condition (the same below).
2) P-value: The significance level of the results. Note: 3 means p value < 0.01, 2 means 0.01 < p value < 0.05, 1 means p value > 0.05.
Evidence: References that support the occurrence of communication for this ligand‒receptor pair.
3) Change: Relative to normal, the current communication is Increase or Decrease in disease condition (the same below).
Bubble Plot: Bubble plot of the probability of each communication through this pathway in the disease condition and control condition. The horizontal axis is the source cell to target cell and the vertical axis is the ligand‒receptor pair. Bubble size is the probability value, and color represents significance, 3 means p value < 0.01, 2 means 0.01 < p value < 0.05, 1 means p value > 0.05.
4) For comparison purposes, we have placed side-by-side the results of the same communication in different conditions, if the communication occurs in both conditions.
Chord Plot: The difference in communication strength through this pathway between the disease condition and the control condition, positive values indicating an upregulation in the disease group, and conversely, negative values indicating a downregulation in the disease group.
Ligand‒Receptor Pairs Search
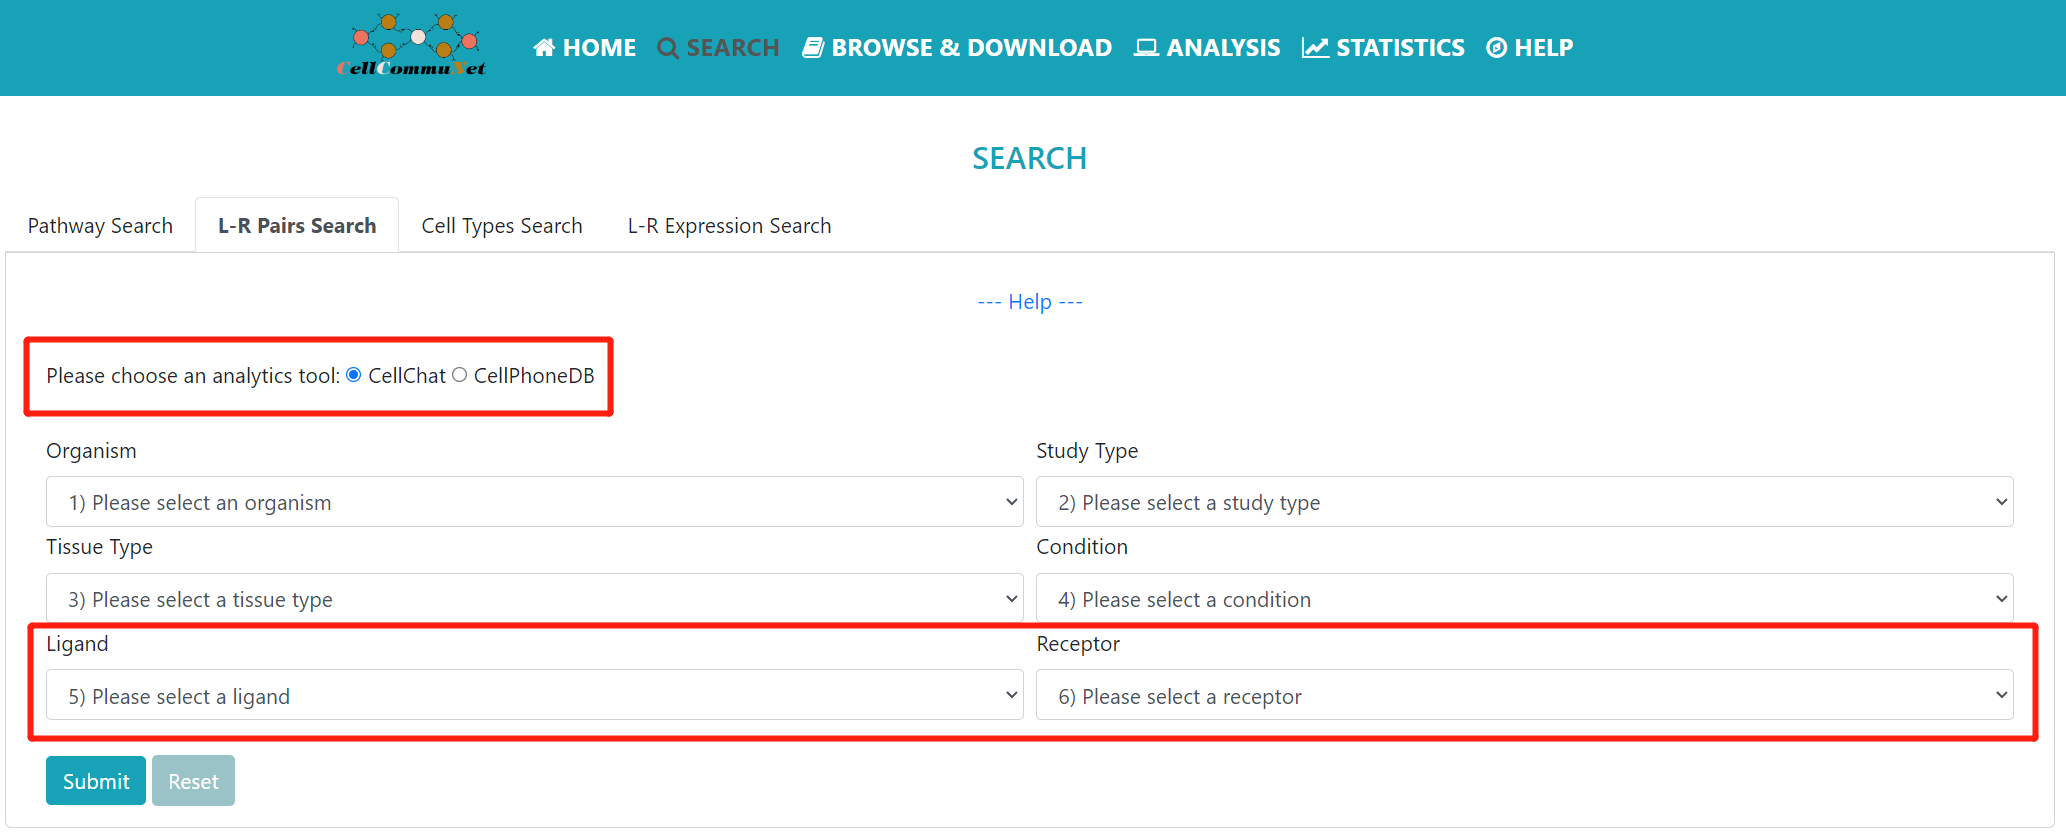
The “L-R Pairs” mode provides a ligand‒receptor pair based search. Users can narrow their search to studies of interest by refining the selection box with keywords, and finally search for ligands and receptors to see which studies have cellular communication mediated through those L-R pairs.
The selection box is similar to the one above, except that you are submitting a query for the ligand‒receptor pair of interest. Additionally, this mode provides results for both CellChat and CellPhoneDB analysis tools. It's worth noting that when selecting to use the CellPhoneDB tool, it is limited to Single study results for Homo sapiens.
Results
The description of result datatable is similar to above, but without the chord plot and heatmap in the Single dataset.
The bubble plot shows the communication probabilities of the queried ligand‒receptor pairs in the current study. The horizontal axis is the source cell to target cell and the vertical axis is the ligand‒receptor pair. Bubble size is the probability value and color represents significance, 3 means p value < 0.01, 2 means 0.01 < p value < 0.05, 1 means p value > 0.05.
The description of the results of the comparison dataset is consistent with the above.
Cell Types Search
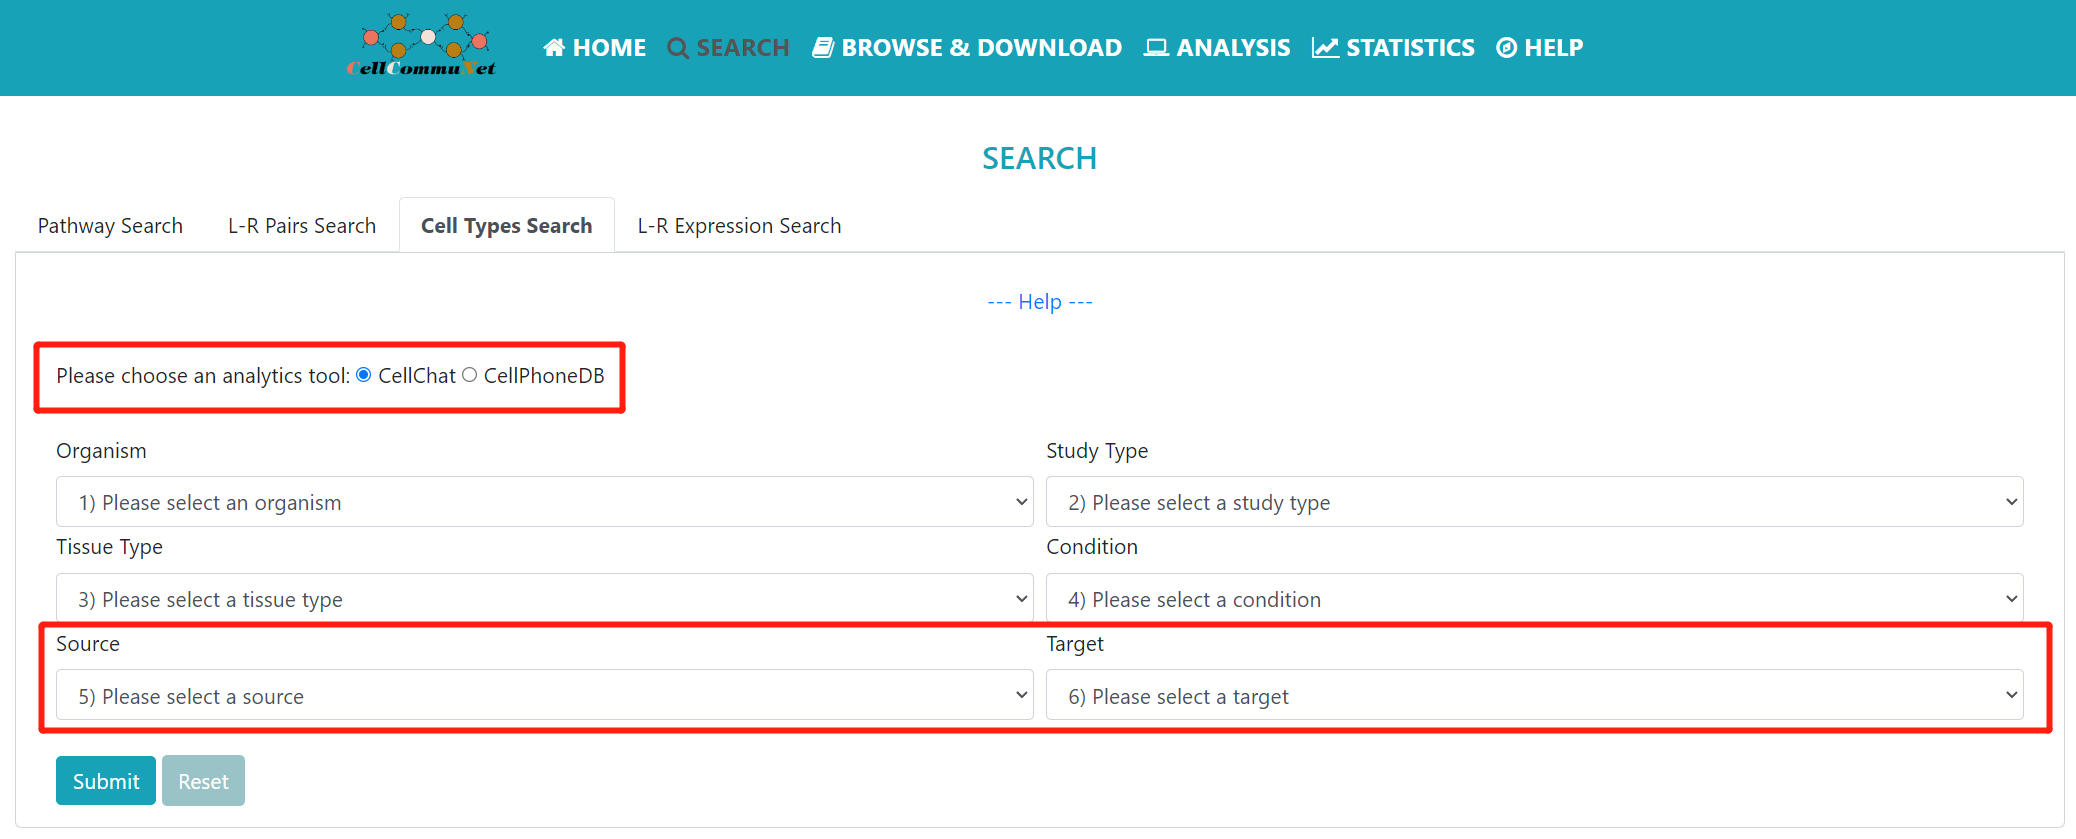
The “Cell Types” mode provides a source and target cell-based search. Users can narrow their search to studies of interest by refining the selection box with keywords and finally search for source cells and target cells to see which studies have cellular communication between the query cells.
The selection box is similar to the one above, except that you are submitting a query for the source cells and target cells of interest. Additionally, this mode provides results for both CellChat and CellPhoneDB analysis tools. It's worth noting that when selecting to use the CellPhoneDB tool, it is limited to Single study results for Homo sapiens.
Results
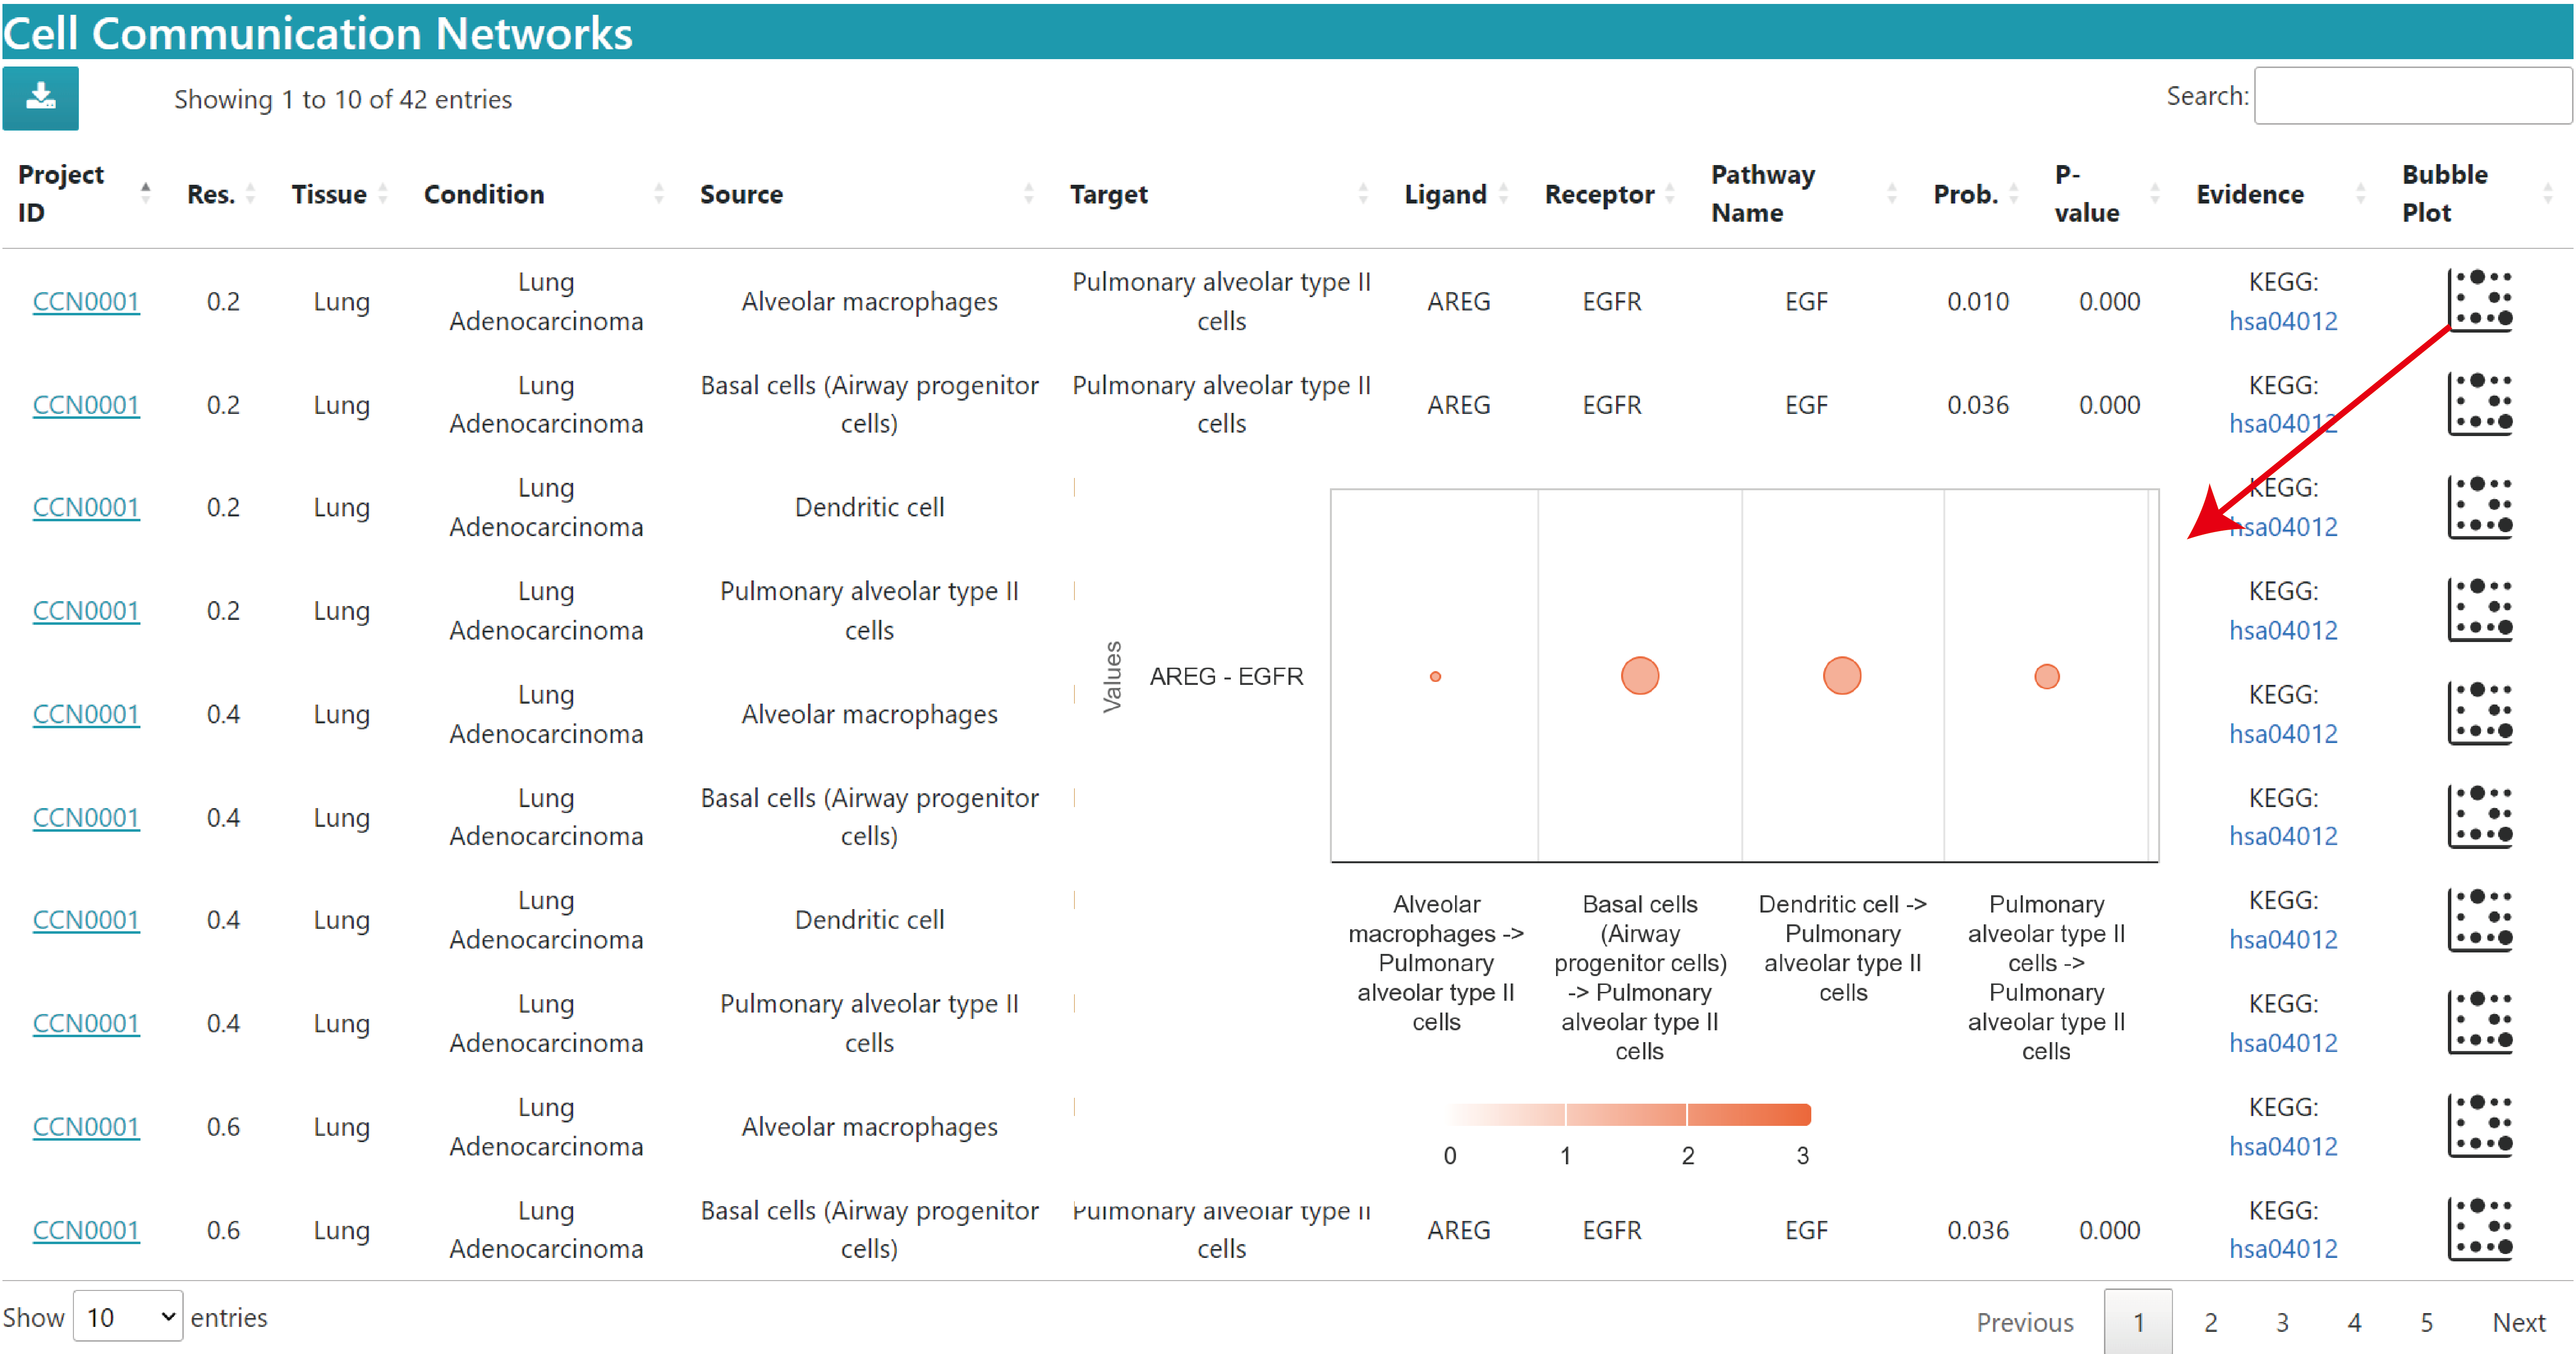
The description of result datatable is similar to above, but without the chord plot and heatmap in the Single dataset.

The bubble plot shows the communication probabilities of the queried source cells and target cells in the current study. The horizontal axis is the source cell to target cell and the vertical axis is the ligand‒receptor pair. Bubble size is the probability value and colour represents significance, 3 means p value < 0.01, 2 means 0.01 < p value < 0.05, 1 means p value > 0.05.
The description of the results of the comparison dataset is consistent with the above.
L-R Expression Search
The "L-R Expression" mode allows users to query the expression levels of interested ligand-receptor genes in the relevant datasets. Users can narrow their search to studies of interest by refining the search box with keywords and finally input the ligands or receptors gene they want to query and retrieve its expression profile in the selected datasets.
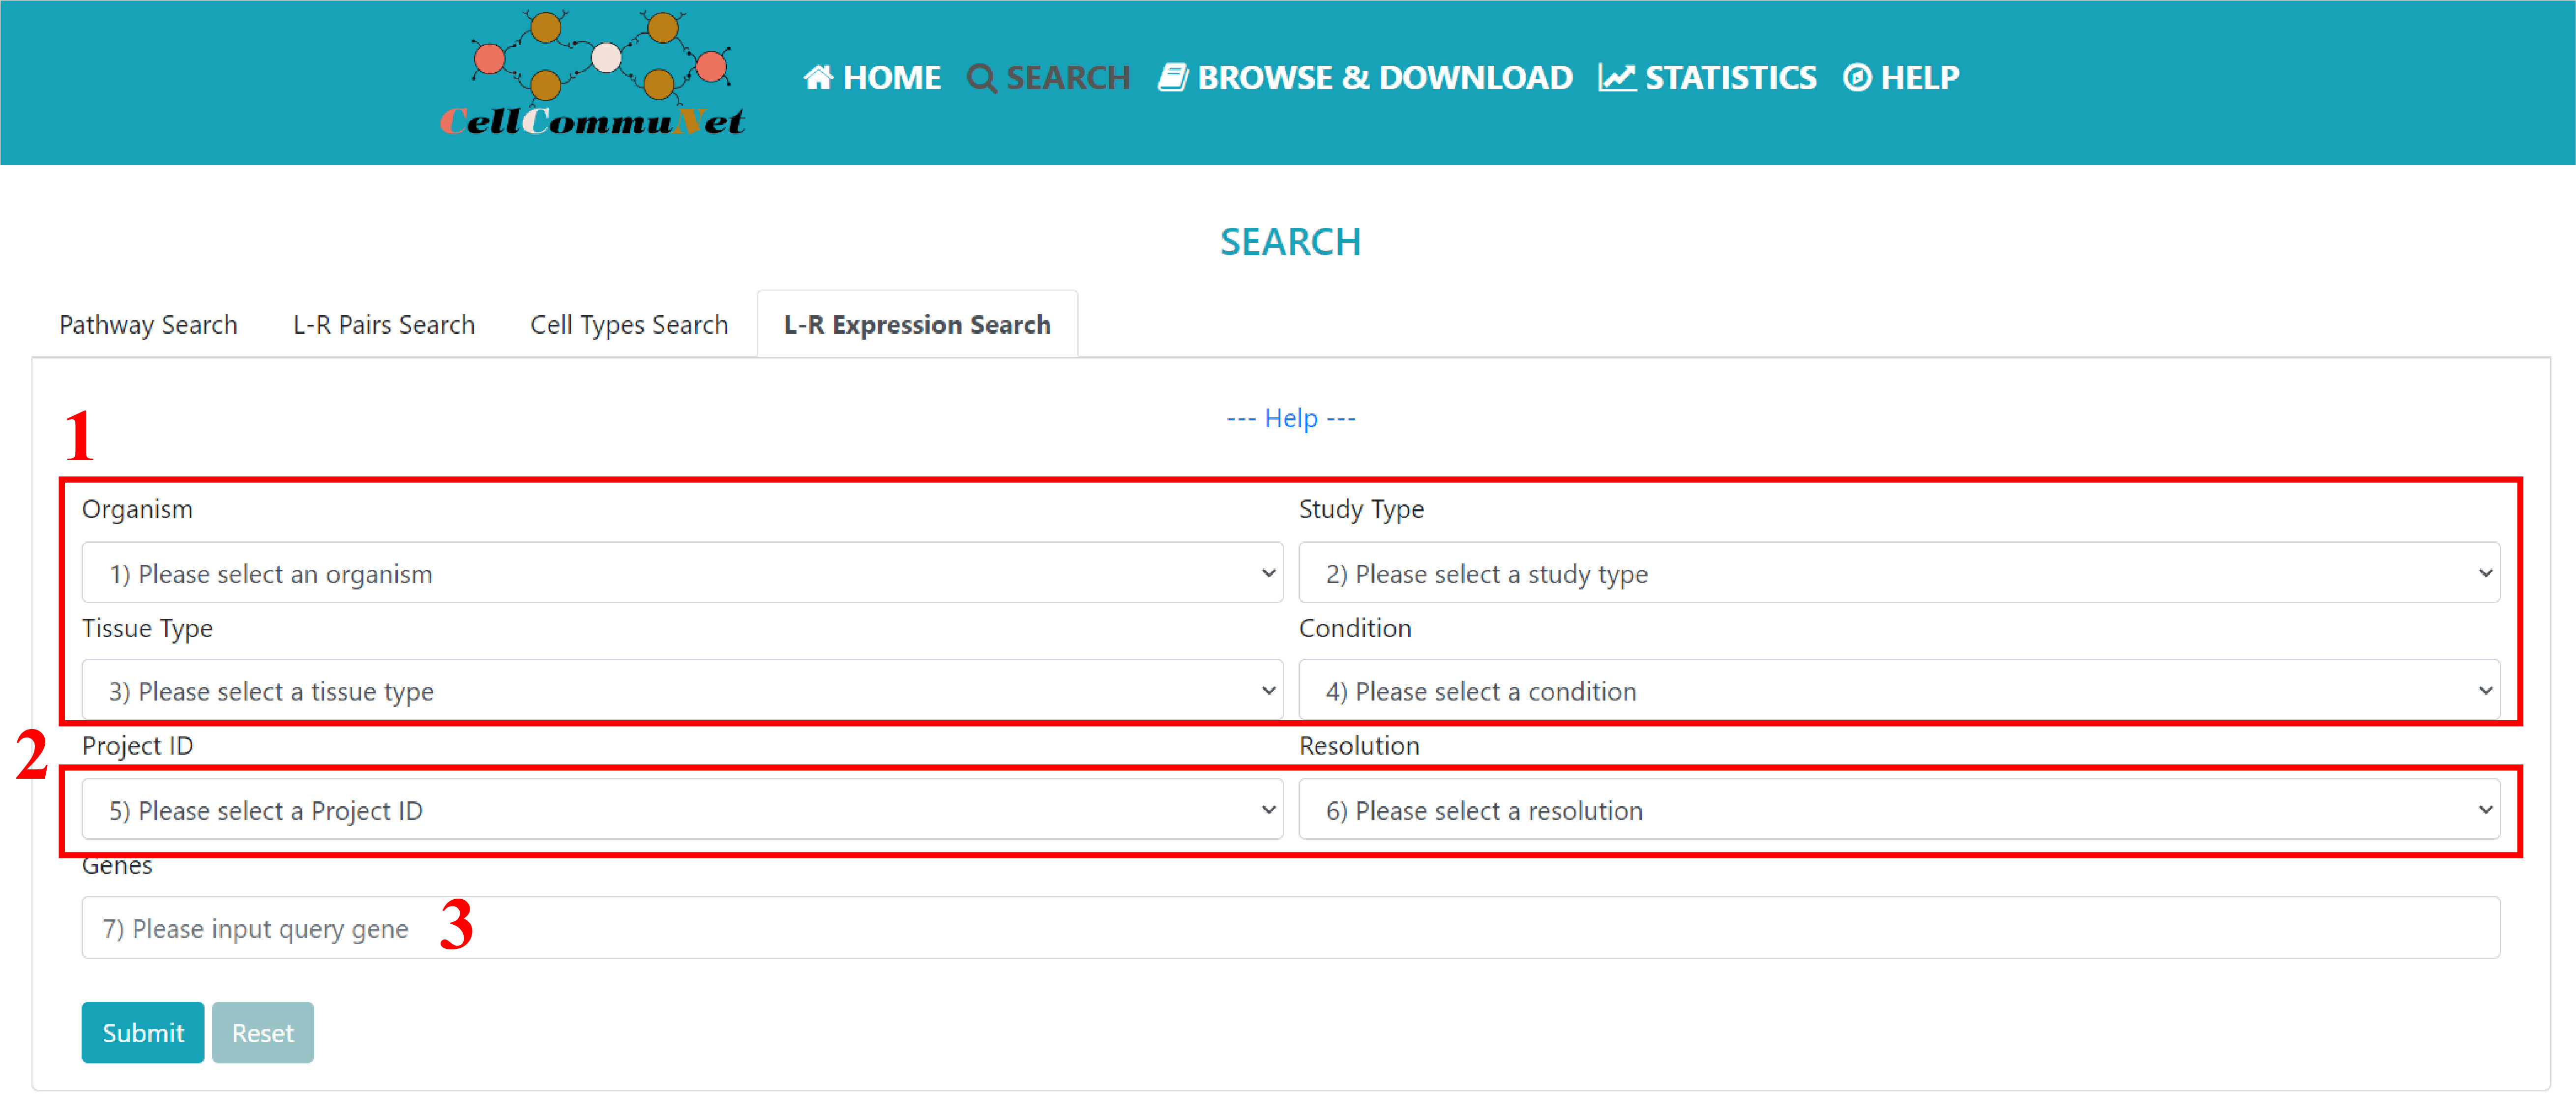
To perform the gene expression query in the L-R expression module, users need to follow these steps:
1) Select the desired datasets using the options provided in Selection Boxes 1 to 4. These options help narrow down the datasets for the analysis.
2) Choose one of the five available resolutions (provided as options) to annotate the cells. This step is crucial as different resolutions can impact the cell annotation results.
3) Input the query genes for the gene expression analysis. It is essential to use semicolons as the separators between multiple genes.
Results
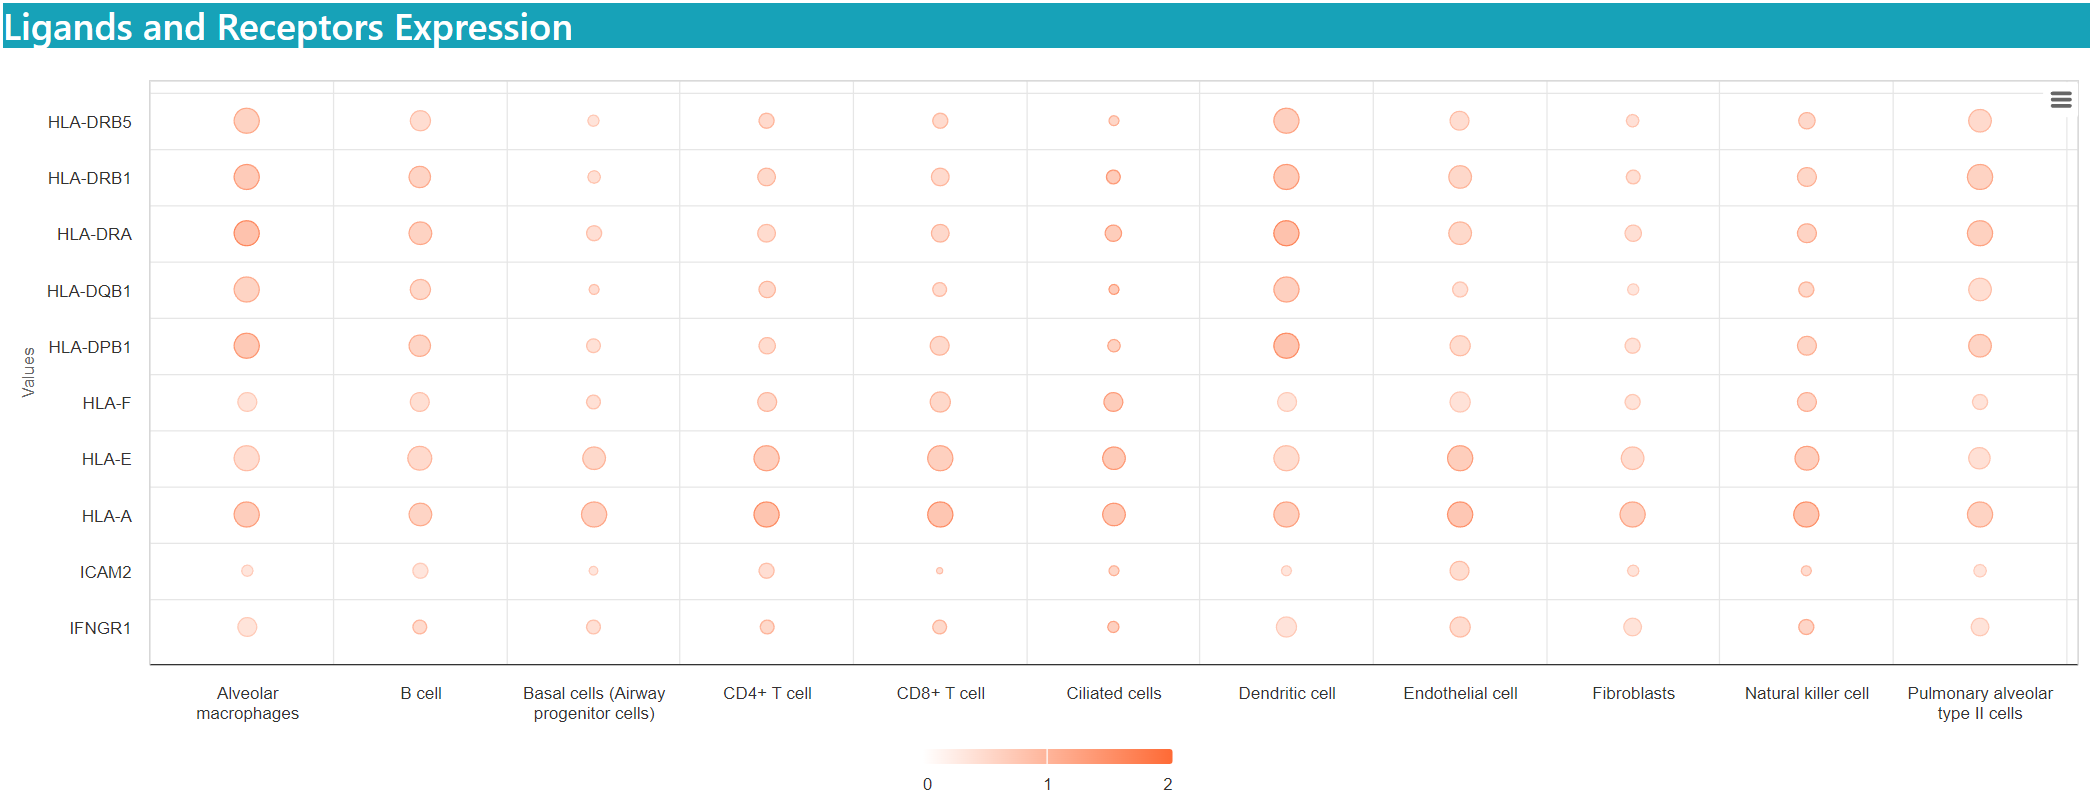
The size representing the percentage of cells expressing the gene, and the color indicting the mean expression value.
Browse & Download
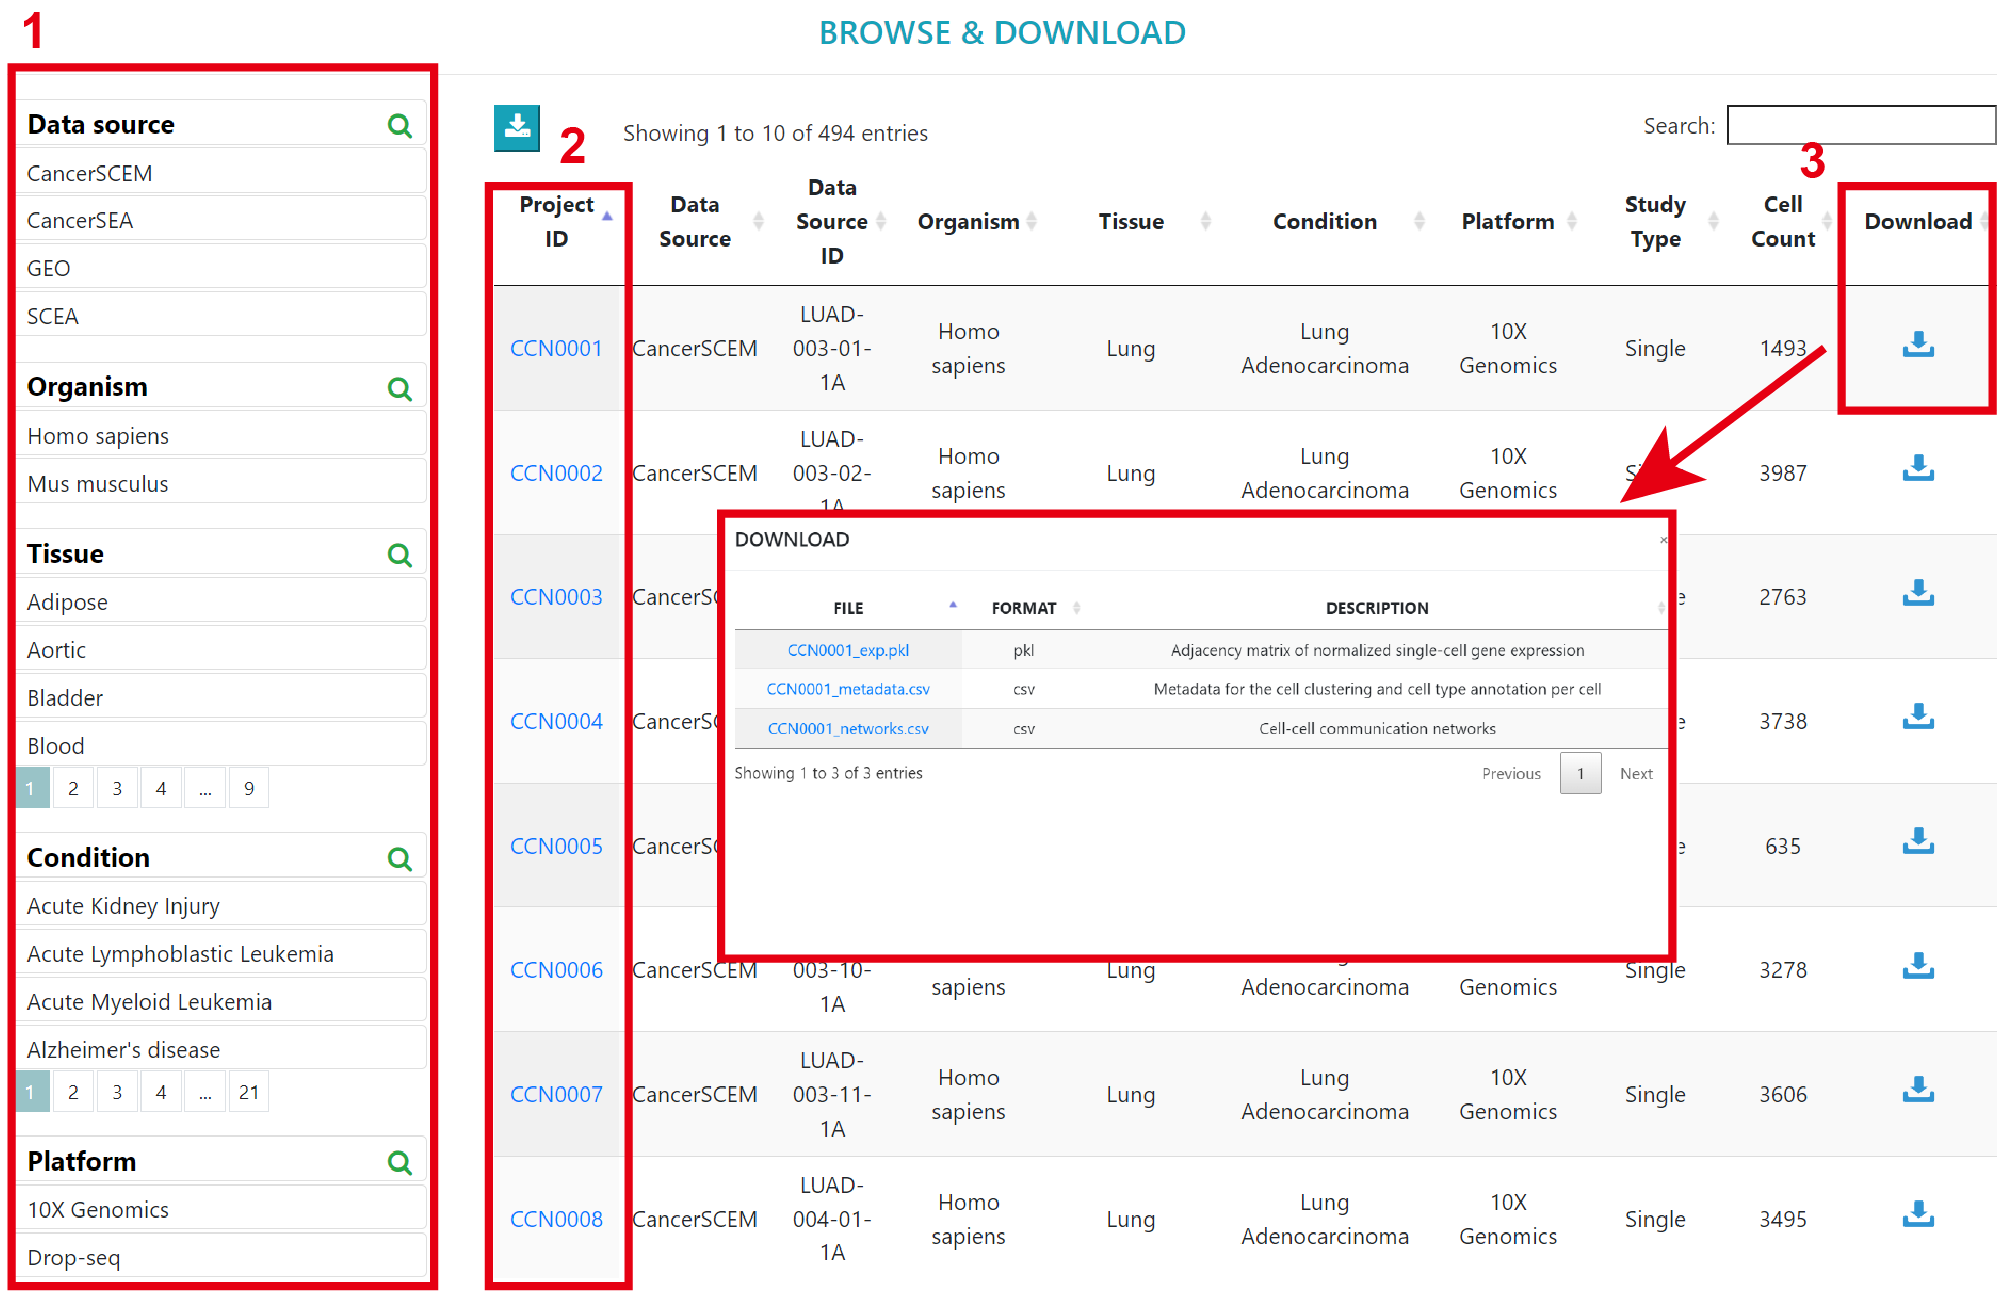
You can browse through Single datasets and Comparison datasets using 1) filters such as Data source, organism, disease and so on. 2) Clicking the dataset ID will lead to a detailed information page showing corresponding cell communication information. 3) Clicking the download to get the expression matrix of scRNA-seq data, cell annotation metadata, and cell‒cell communication analysis results for the current dataset. In order to minimize file size for easy downloading, we have converted the expression matrix into an adjacency matrix and stored it in pickle format for download.
Detailed Information Page
The detailed information page contains basic information about the studies in this dataset. For a single dataset, we provide results for the clustering and cell type annotation of single cells, gene expression query functions, marker gene list, total intensity of cellular communication, and pattern analysis of cellular communication. For comparative studies, we provide the differences in communication intensity between disease and normal states, the up- and down-regulation of communication between two specific cell types, and the relative signalling flows of the pathways involved.
Single Dataset Detail
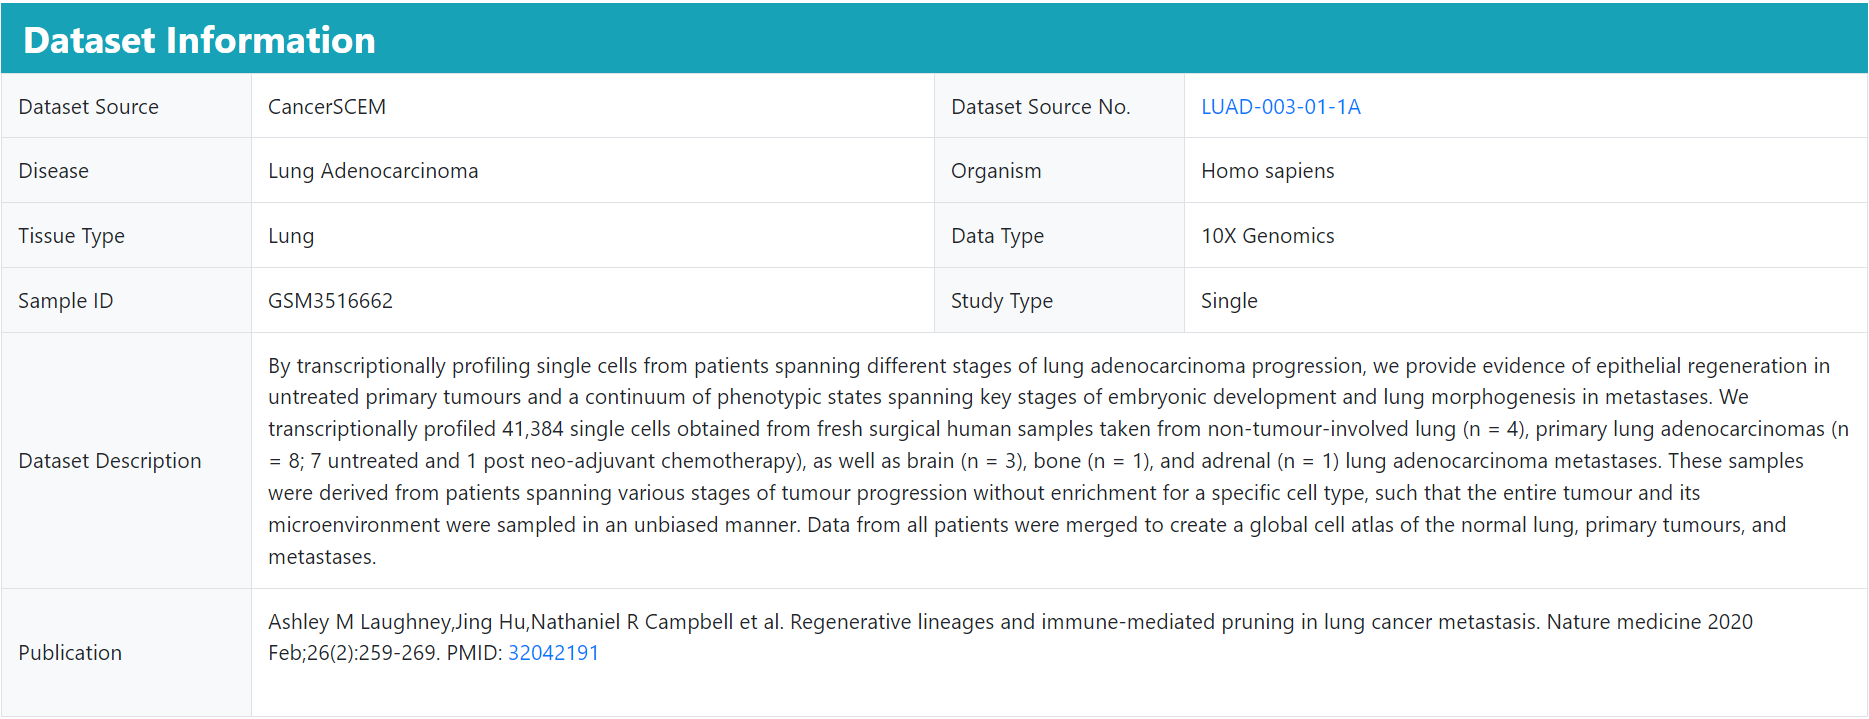
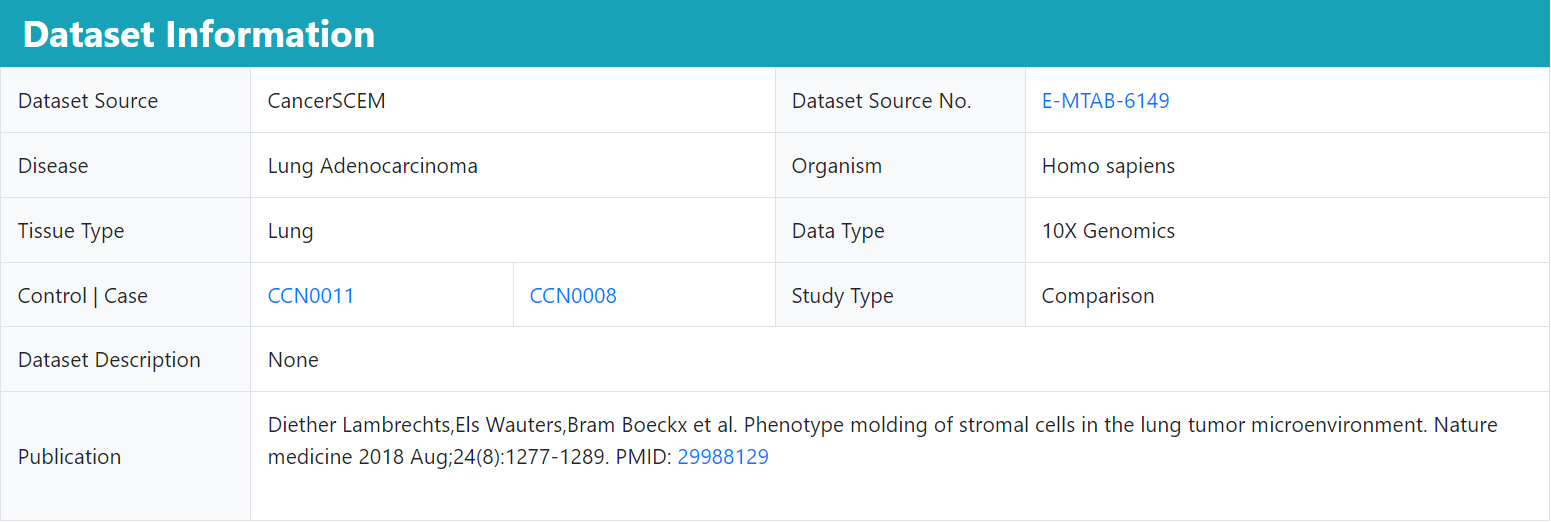
The basic information details the source of this dataset and the description of the corresponding study, and users can also jump to the web page by clicking on the link.
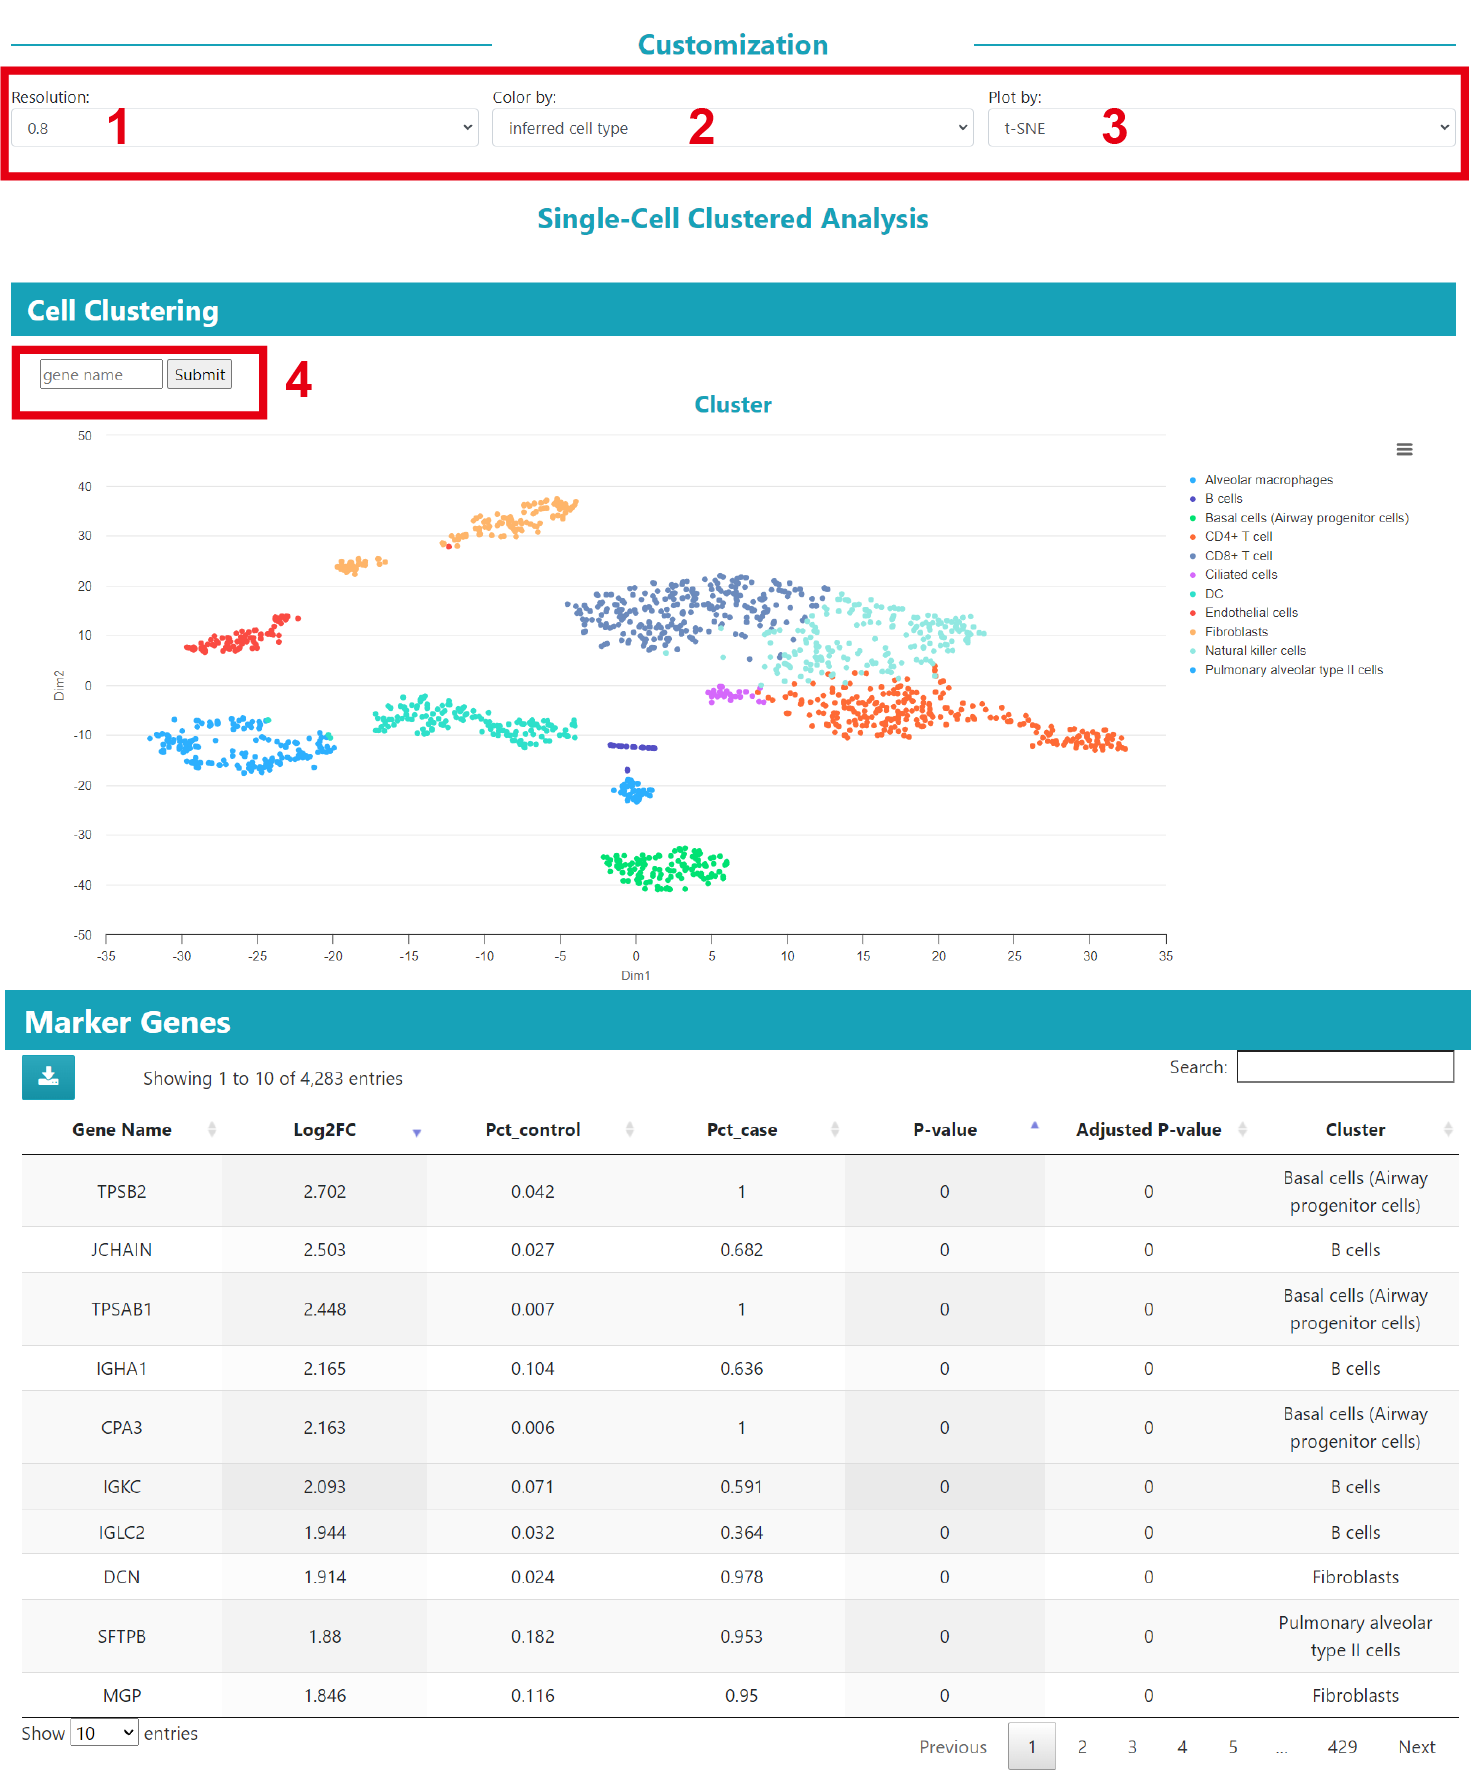
We provide results for single cell clustering, cell annotation and marker genes. By selecting different parameters(1) resolution; 2) color by; and 3) plot by), the user can obtain the corresponding cell clustering results (Note: the resolution parameter also affects the results of cell communication analysis). In addition, the user can 4) query the expression of genes in the dataset.
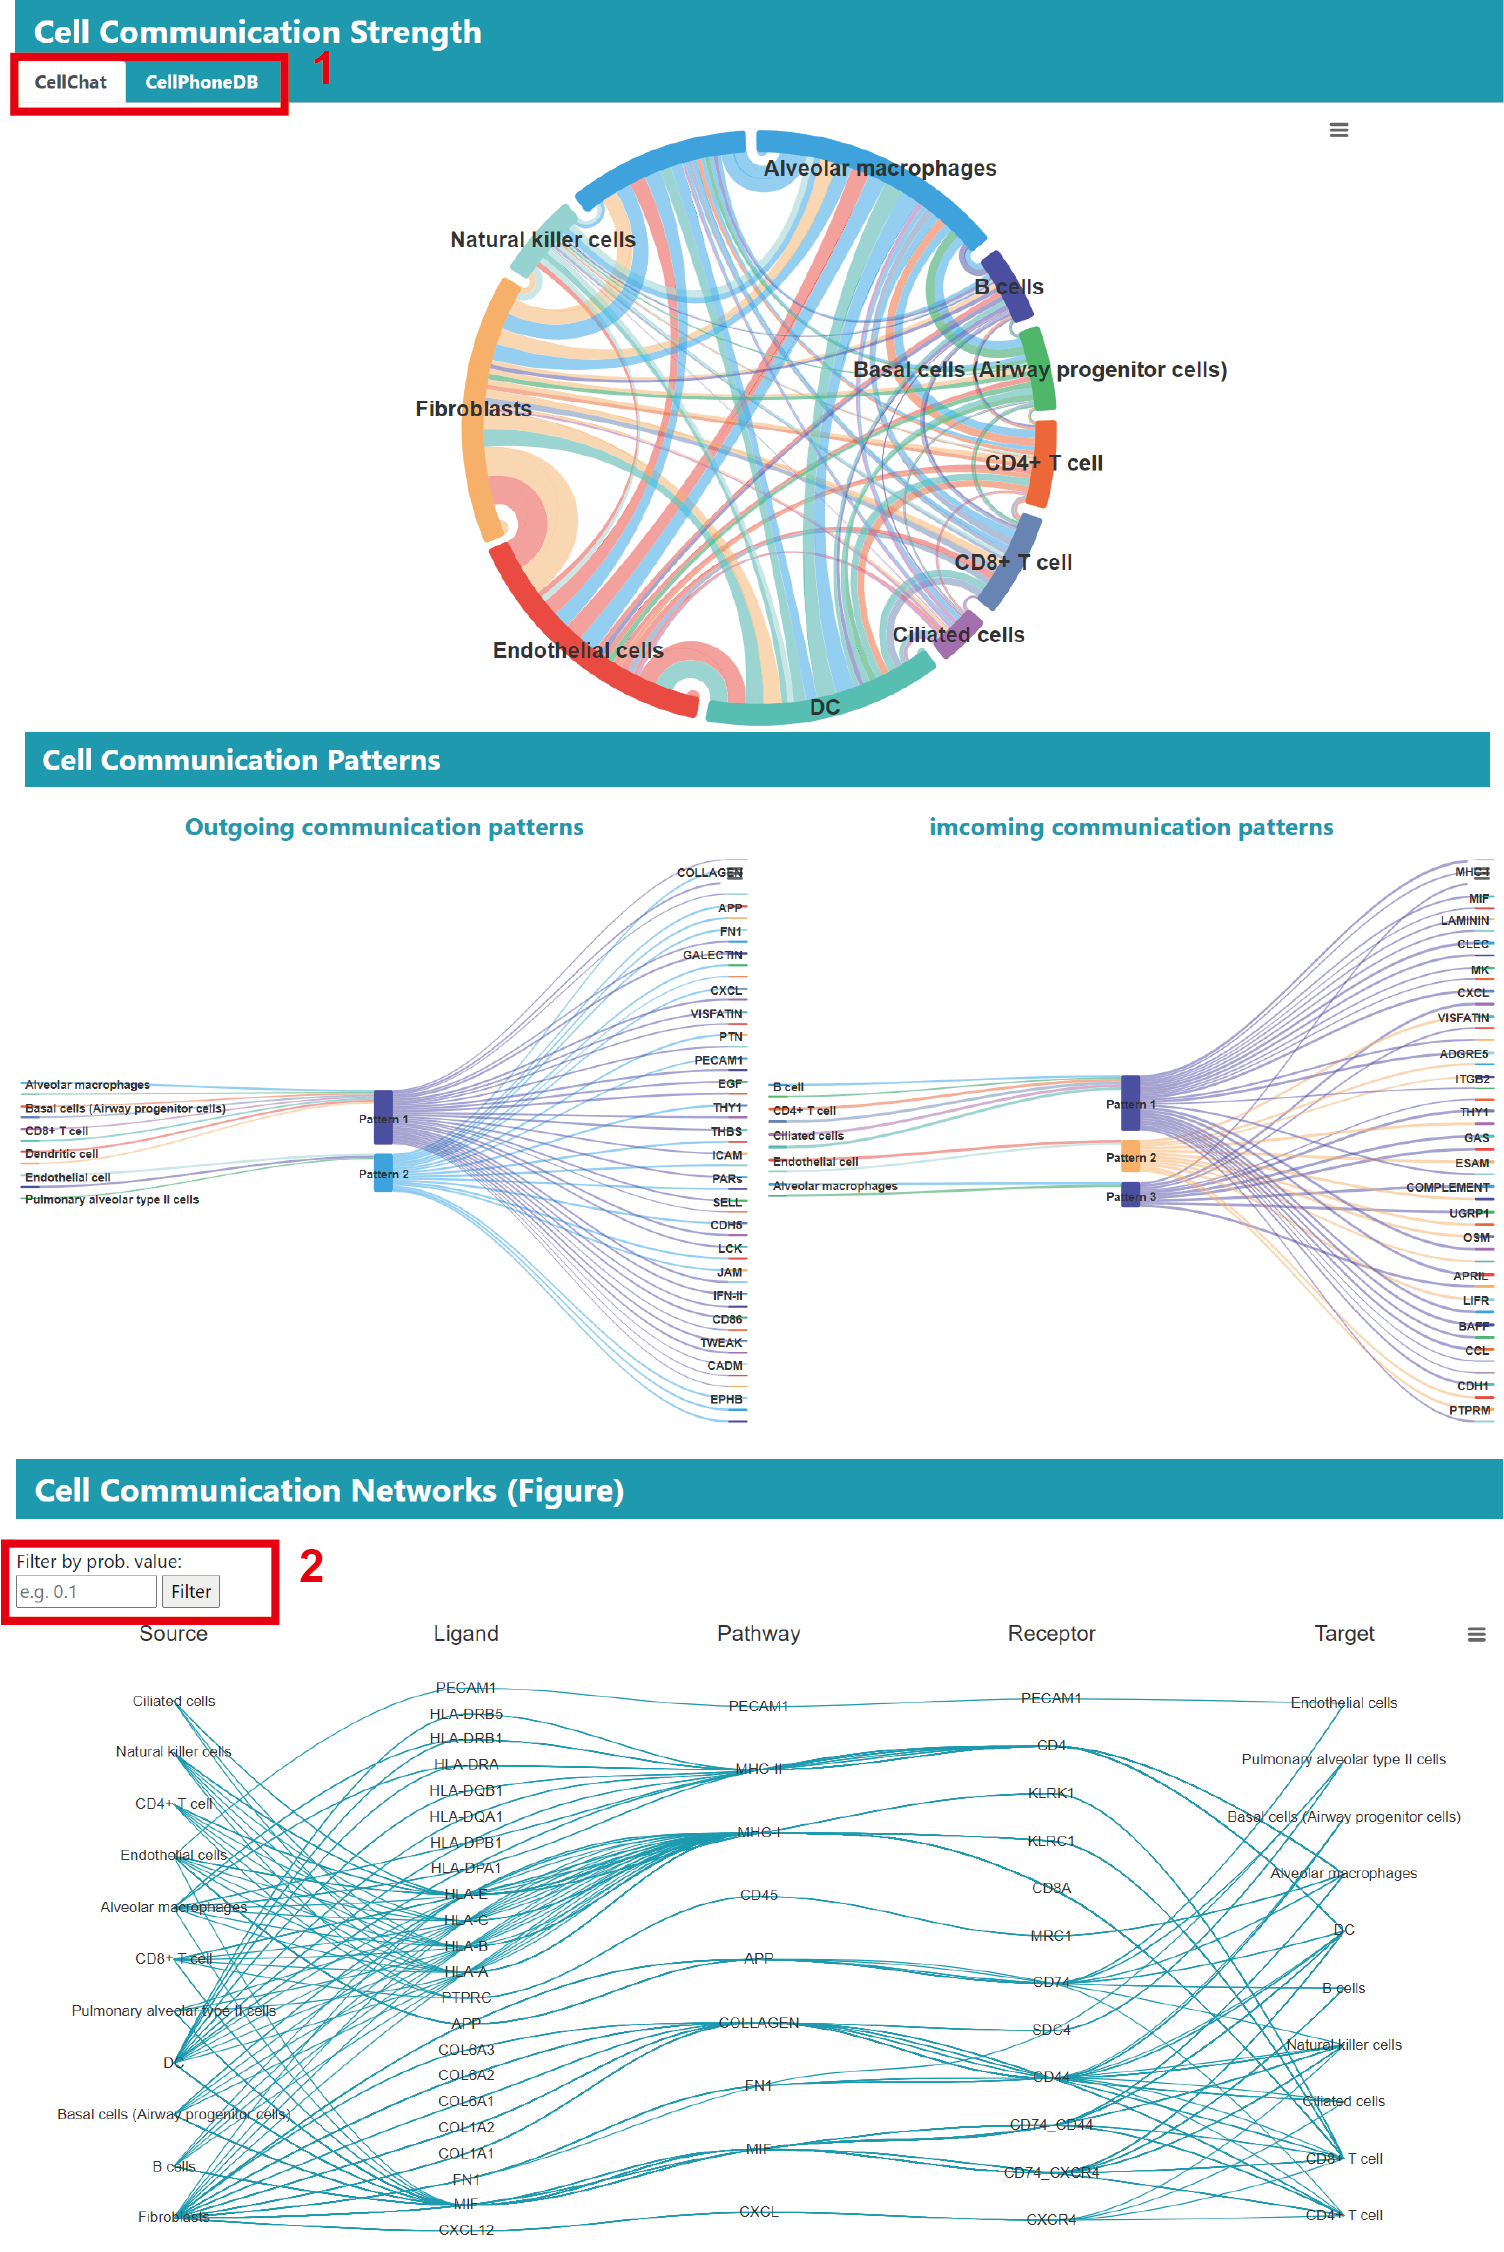
For the cell‒cell communication analysis results, the chord diagram shows the total strength of communication between all cell types in the current study, 1) including CellChat and CellPhoneDB.
Sankey plots are used to illustrate how communication between cells in this study is coordinated with the various pathways, with the pattern of outgoing signals on the left and the incoming signals on the right.
We also provide cellular communication network, which by default display the top 50% of communication strengths. 2) Users can also filter the results based on communication probability values.
Note: Some studies may not be suitable for cell communication analysis due to, for example, too few cell types, and here, we recommend that you adjust the resolution parameters for exploration.
Finally, we provide a summary table of the results of the communication analysis of this dataset to allow users to self-explore the results of interest.
Comparison Dataset Detail
We provide basic information on the comparison studies, including data source and normal | disease study ID. Users can also browse the results of relevant individual study analyses by clicking on the ID.
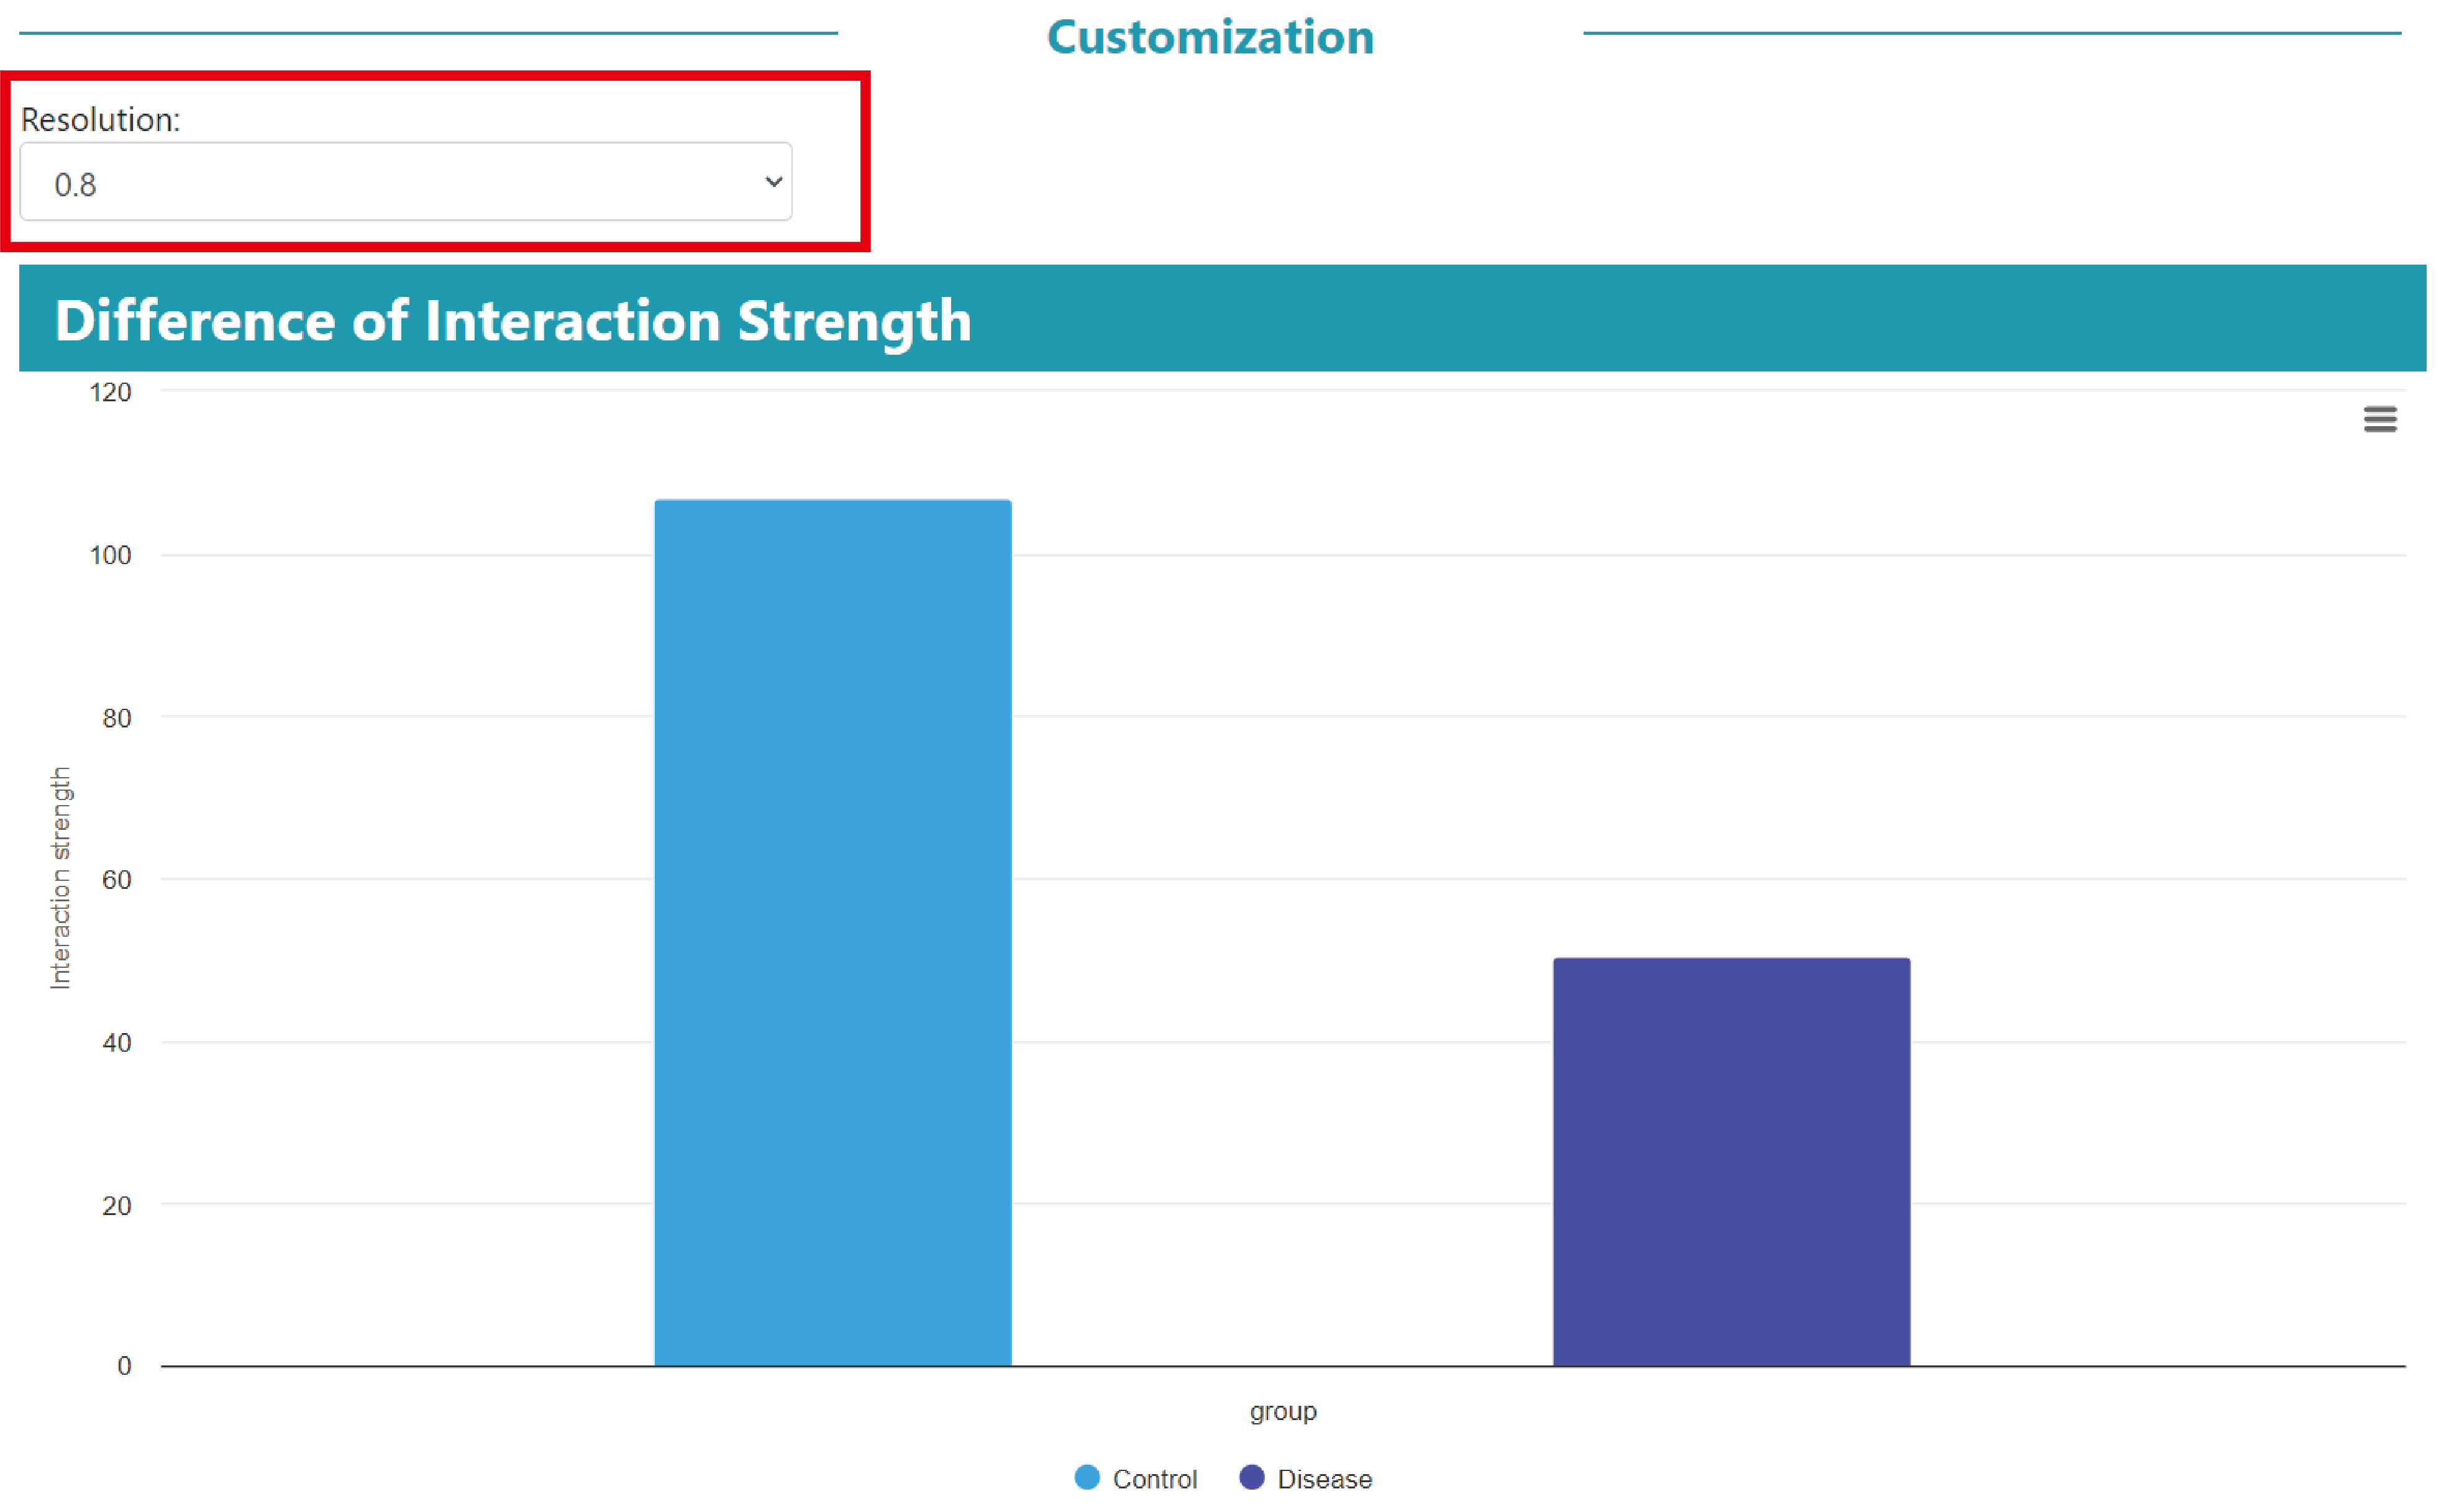
Similarly, users can modify the resolution parameters to obtain the corresponding results.
Then, we compared the differences in the total strength of cell‒cell communications in diseased and normal samples and visualised them using a bar plot.
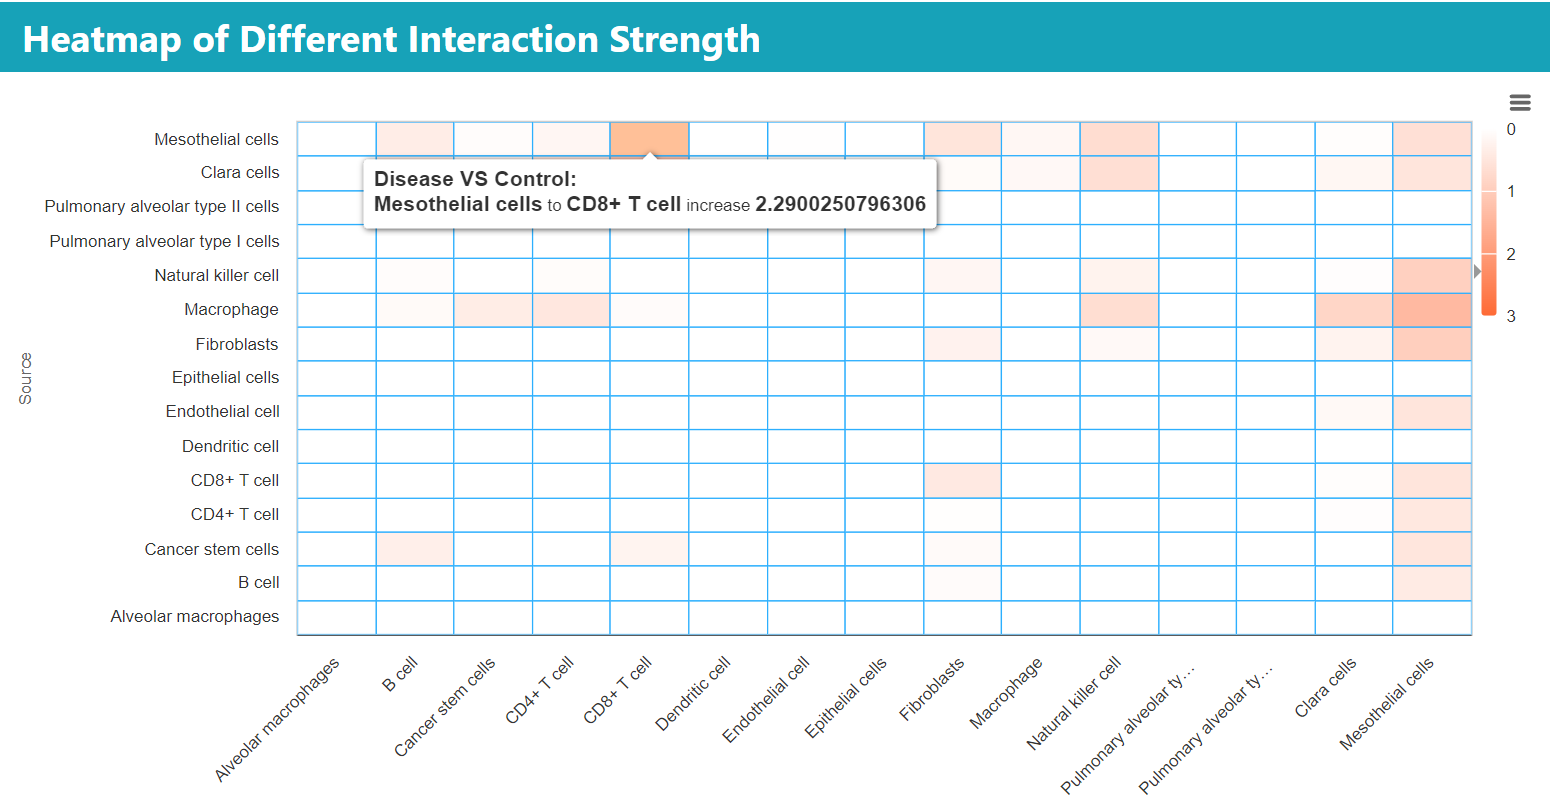
Heatmap for comparing source-to-target cell signal strength between disease and normal groups. As shown, the hover boxes indicated that the communication strength from mesothelial cells to CD8+ T cells was increased by 2.29 in the disease group relative to the control group.
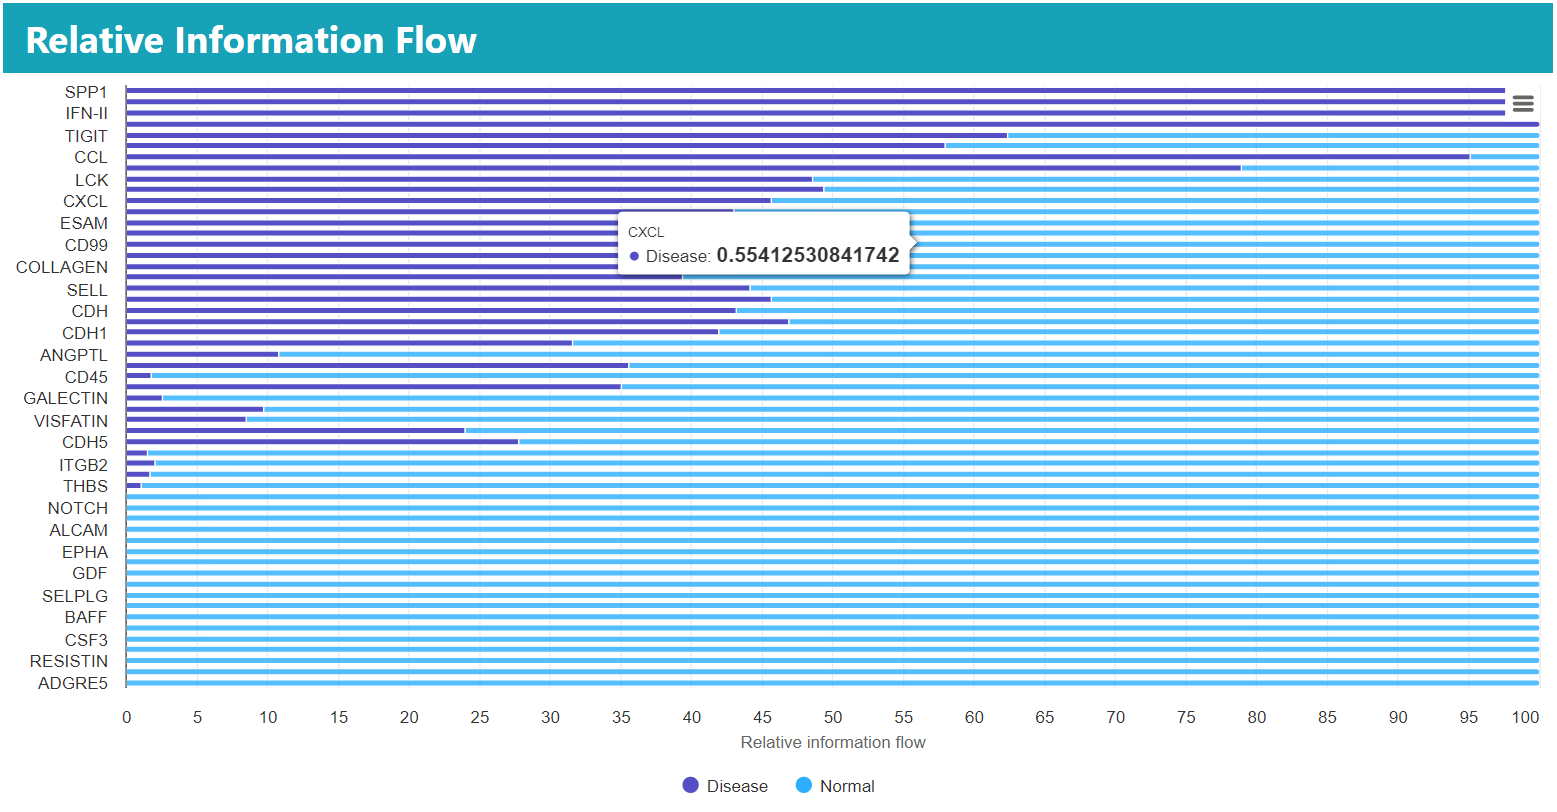
The results in the stacked bar chart allow the user to compare the relative information flow of each pathway and are used to illustrate which pathways differ between groups.
Finally, we also provide a summary table of communication differences analysis to help users in their self-exploration.
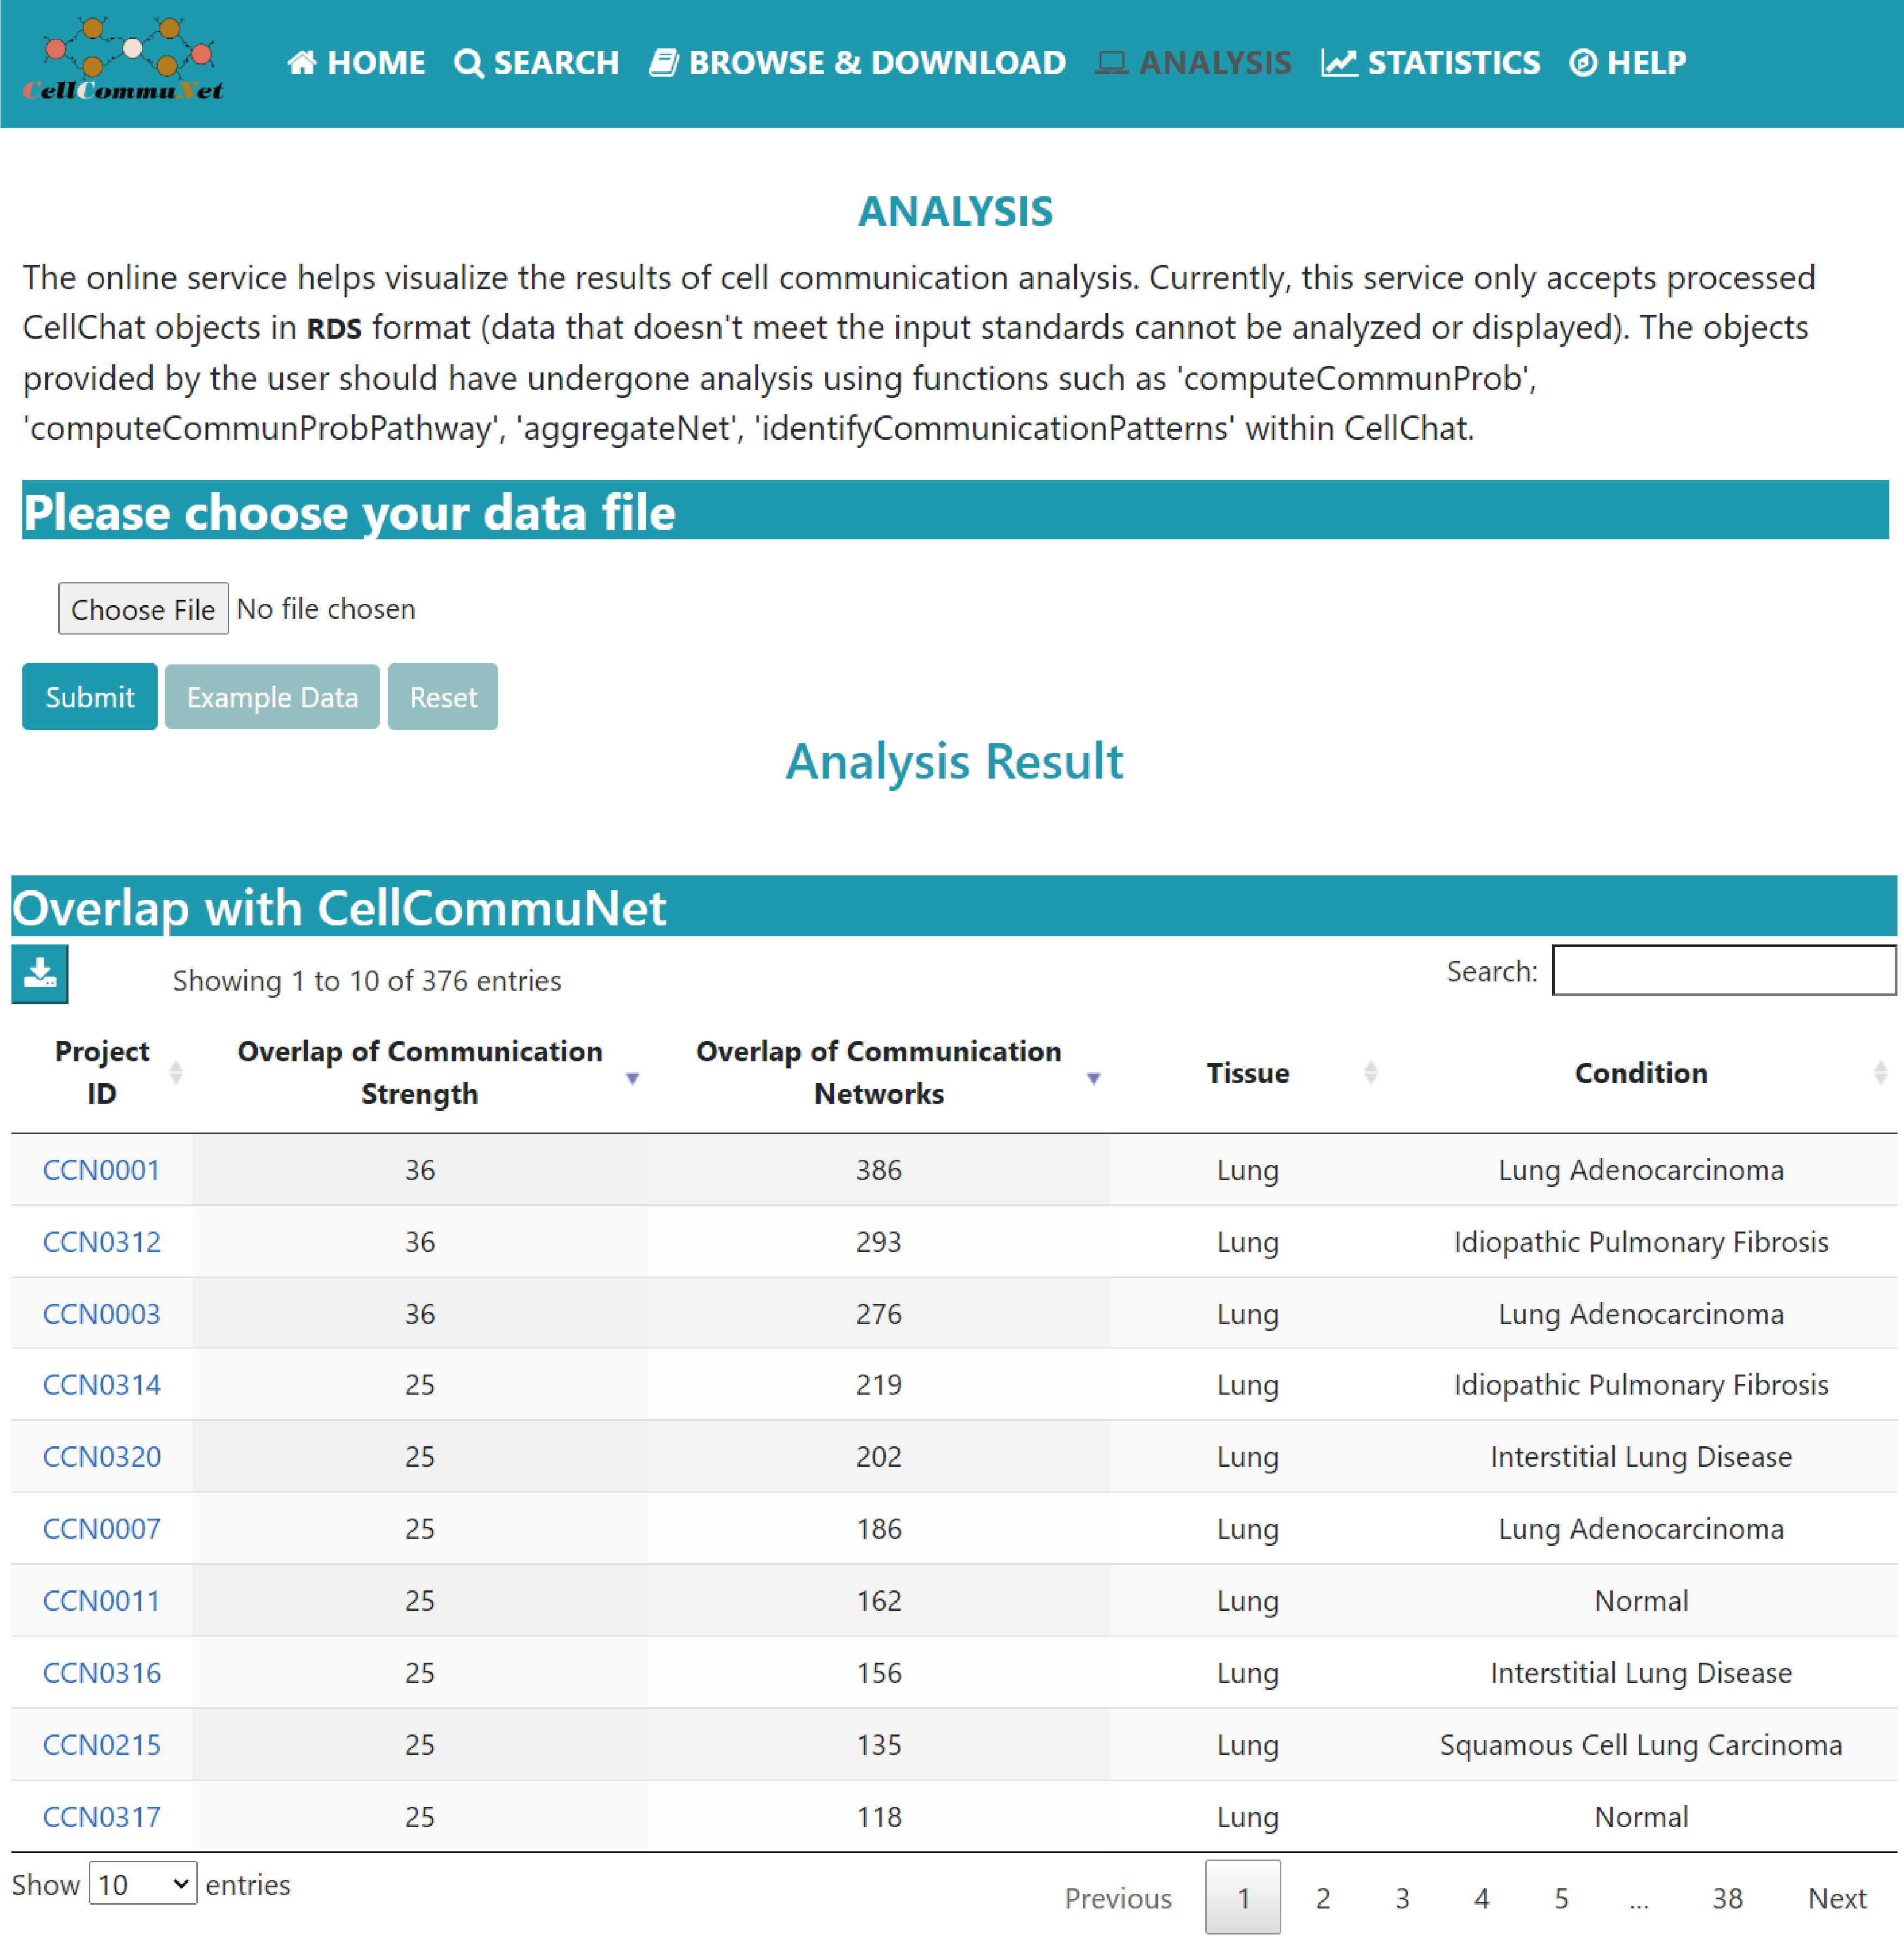
Analysis
The analysis page enables users to upload their own processed CellChat objects to explore and visualize the results of the cell‒cell communication analysis.
This function also provides a list of CellCommuNet datasets and the corresponding numbers of common nonredundant cell‒cell communication networks with the user’s dataset.
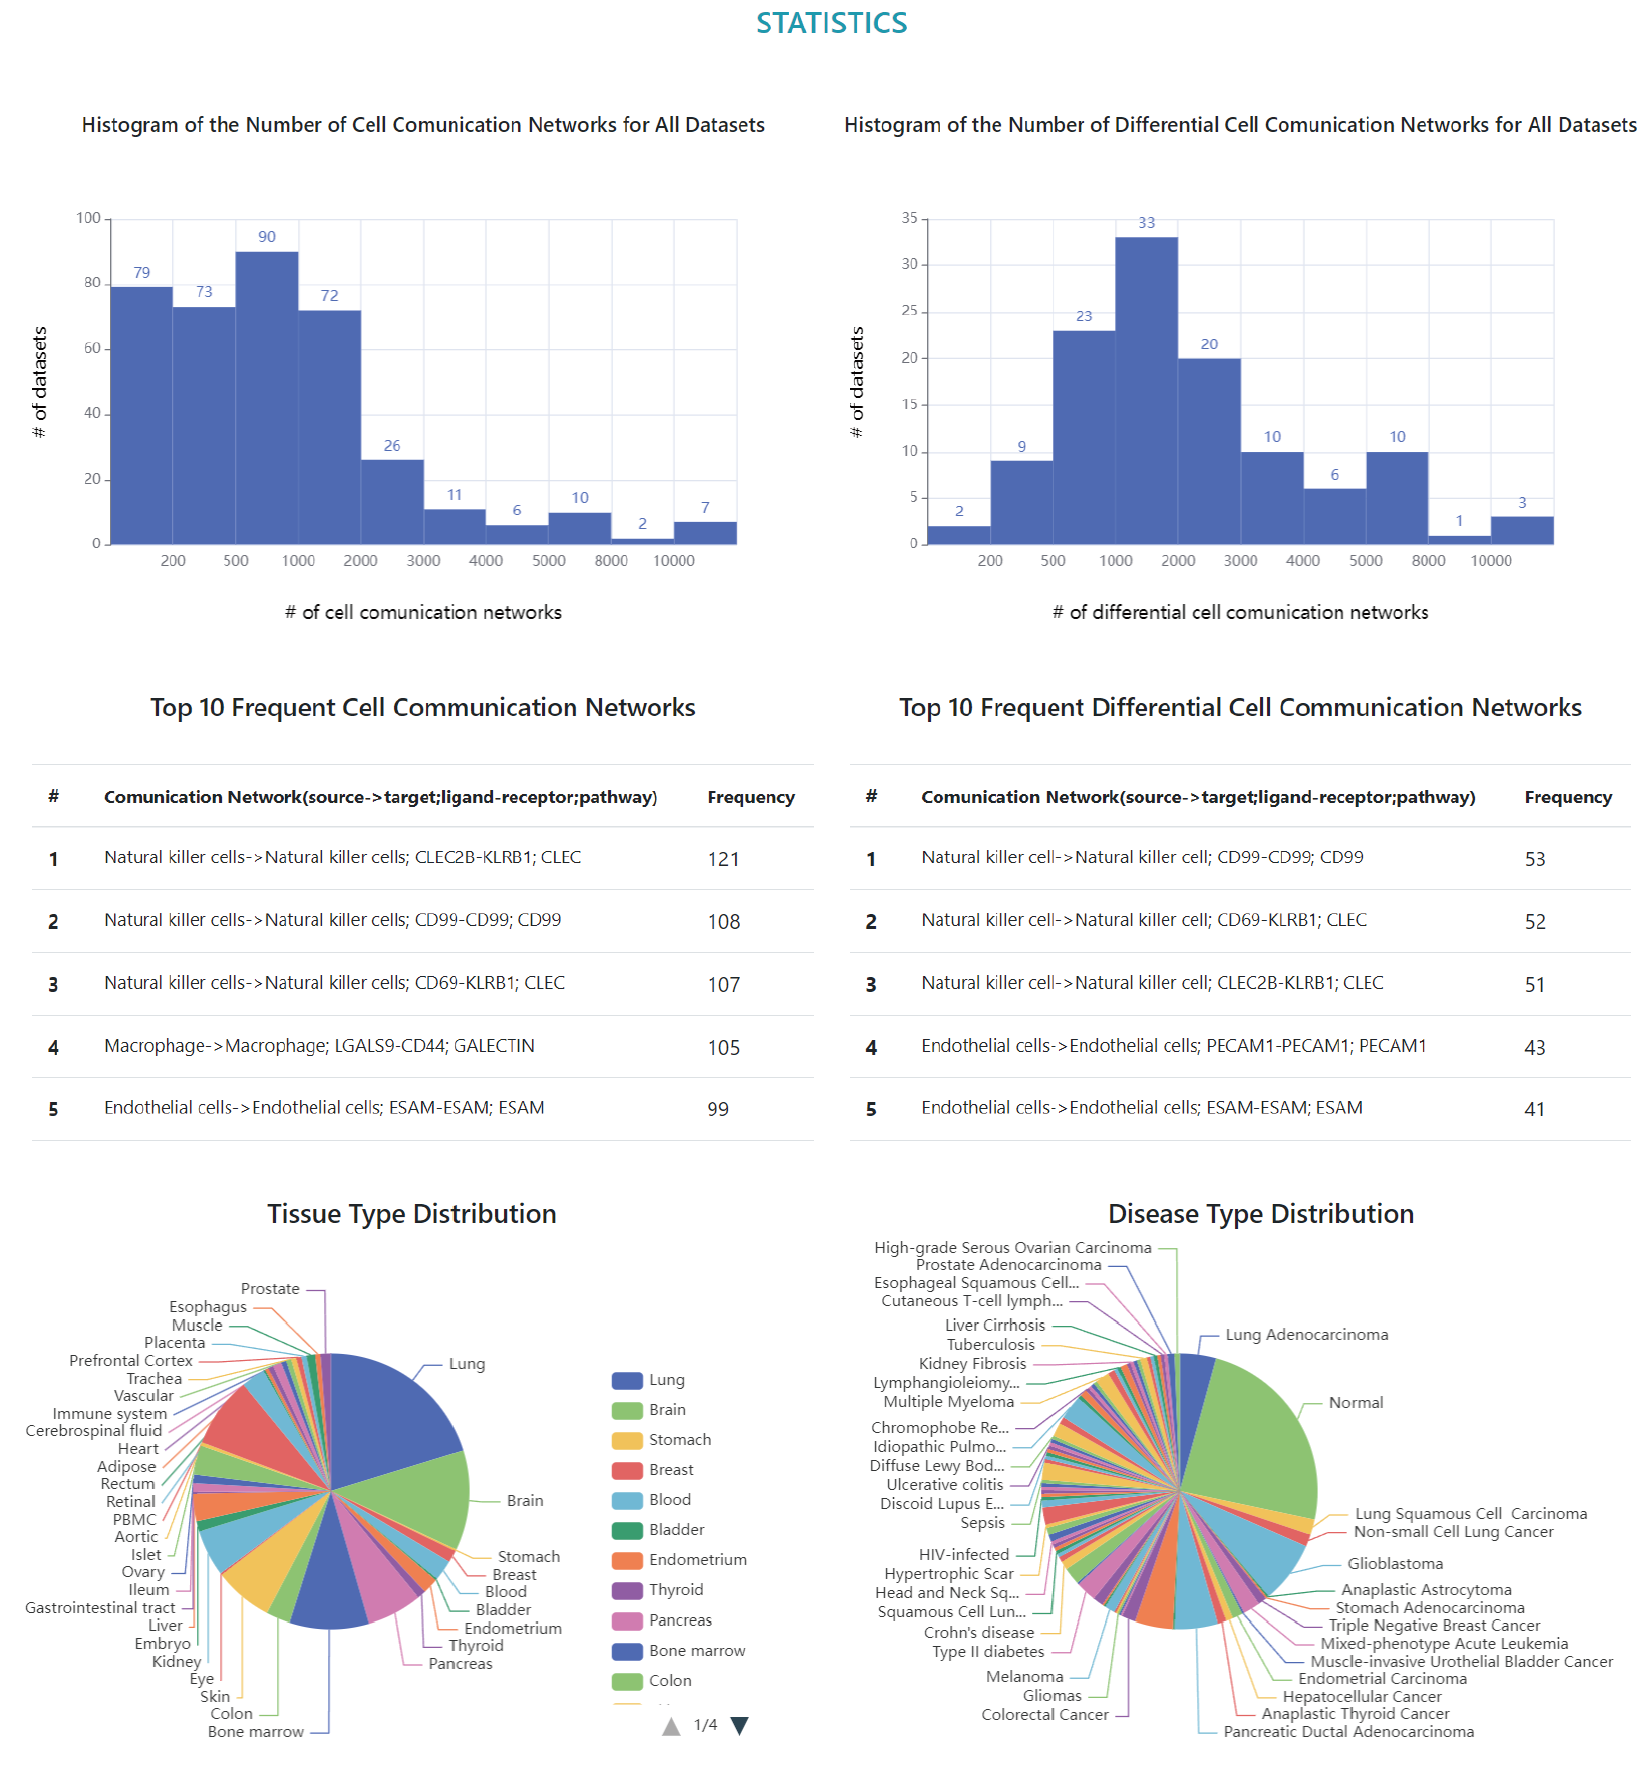
Statistics
Sample statistics of CellCommuNet.
- Please feel free to contact Professor Jianbo Pan with respect to any details pertaining to CellCommuNet!
-
>Address :
Center for Novel Target and Therapeutic Intervention, Institute of Life Sciences, Chongqing Medical University,
No. 1 Yixueyuan Road, Yuzhong District, Chongqing, 400016, P. R. China.
-
>Email :
panjianbo@cqmu.edu.cn