Gene therapy, including DNA therapy and RNA therapy, is a medical approach that transfers genetic material, either DNA or RNA, into individuals to prevent or treat a disease. Genetically-modified cell therapies such as CAR-T and TCR-T are also considered as forms of gene therapy. In recent years, more and more gene therapies are being developed, tested in clinical trials, and even approved for clinical use worldwide.
DNA therapy
DNA therapy-based gene therapy is a DNA-based approach that introduces normal or therapeutic genes into a patient's body using viral vectors, plasmids, or other effective gene delivery tools. Its primary objective is to compensate for or replace defective genes, thereby addressing genetic disorders or related conditions.
RNA therapy
RNA therapy-based gene therapy utilizes RNA molecules to modulate gene expression as a therapeutic strategy. This approach encompasses various RNA types, including siRNA (small interfering RNA), miRNA (microRNA), ASO (antisense oligonucleotides), RNA aptamers, mRNA vaccines, and shRNA (short hairpin RNA). These molecules are introduced to either enhance or suppress the expression of specific genes, thereby regulating cellular functions and treating diseases.
Genetically-modified cell therapy
Genetically-modified cell therapies, including CAR-T (Chimeric Antigen Receptor T-cell) and TCR-T (T-cell Receptor-engineered T-cell) therapies, use genetic engineering to enhance the ability of cells to fight diseases, particularly cancer. CAR-T therapy modifies a patient’s T cells to express receptors targeting specific cancer cell antigens, showing success in treating B-cell malignancies. TCR-T cells can recognize intracellular antigens, which makes them suitable for treating solid tumors.
Clinical trial data refers to the information collected through systematic studies to evaluate the safety and efficacy of new drugs, treatments, or medical devices in humans. These data typically include participant demographics, treatment protocols, observed outcomes during treatment, assessments of treatment effectiveness, and records of adverse events that may occur.
A gene is declared differentially expressed if a difference or change observed in read counts or expression levels between two conditions (here, after and before gene therapy) is statistically significant.
Gene expression data before and after gene therapy are measured using microarray, bulk RNA-Seq, and scRNA-Seq, et al. For microarray data, Limma is used for differential gene analysis. For bulk RNA-Seq data, hisat2/featurecounts are used, while CellRanger is applied for scRNA-Seq data. An adjusted P-value of less than 0.05 is considered statistically significant in all analyses, ensuring that the observed changes in gene expression are unlikely to be due to random chance.
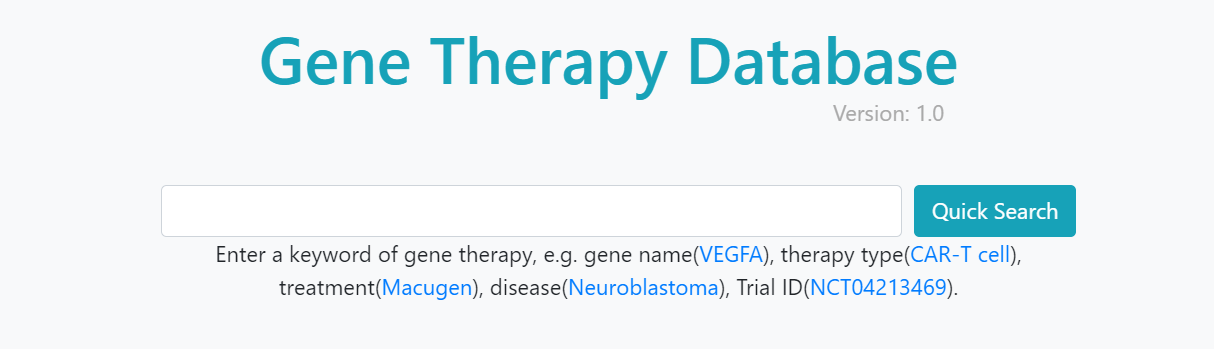
Fuzzy query is enabled. In the main page, clinical trial data can be quickly searched by gene name, therapy type, treatment, disease, and Trial ID. After submitting the keywords, click the "Quick Search" button to enter the results page.
Search result page
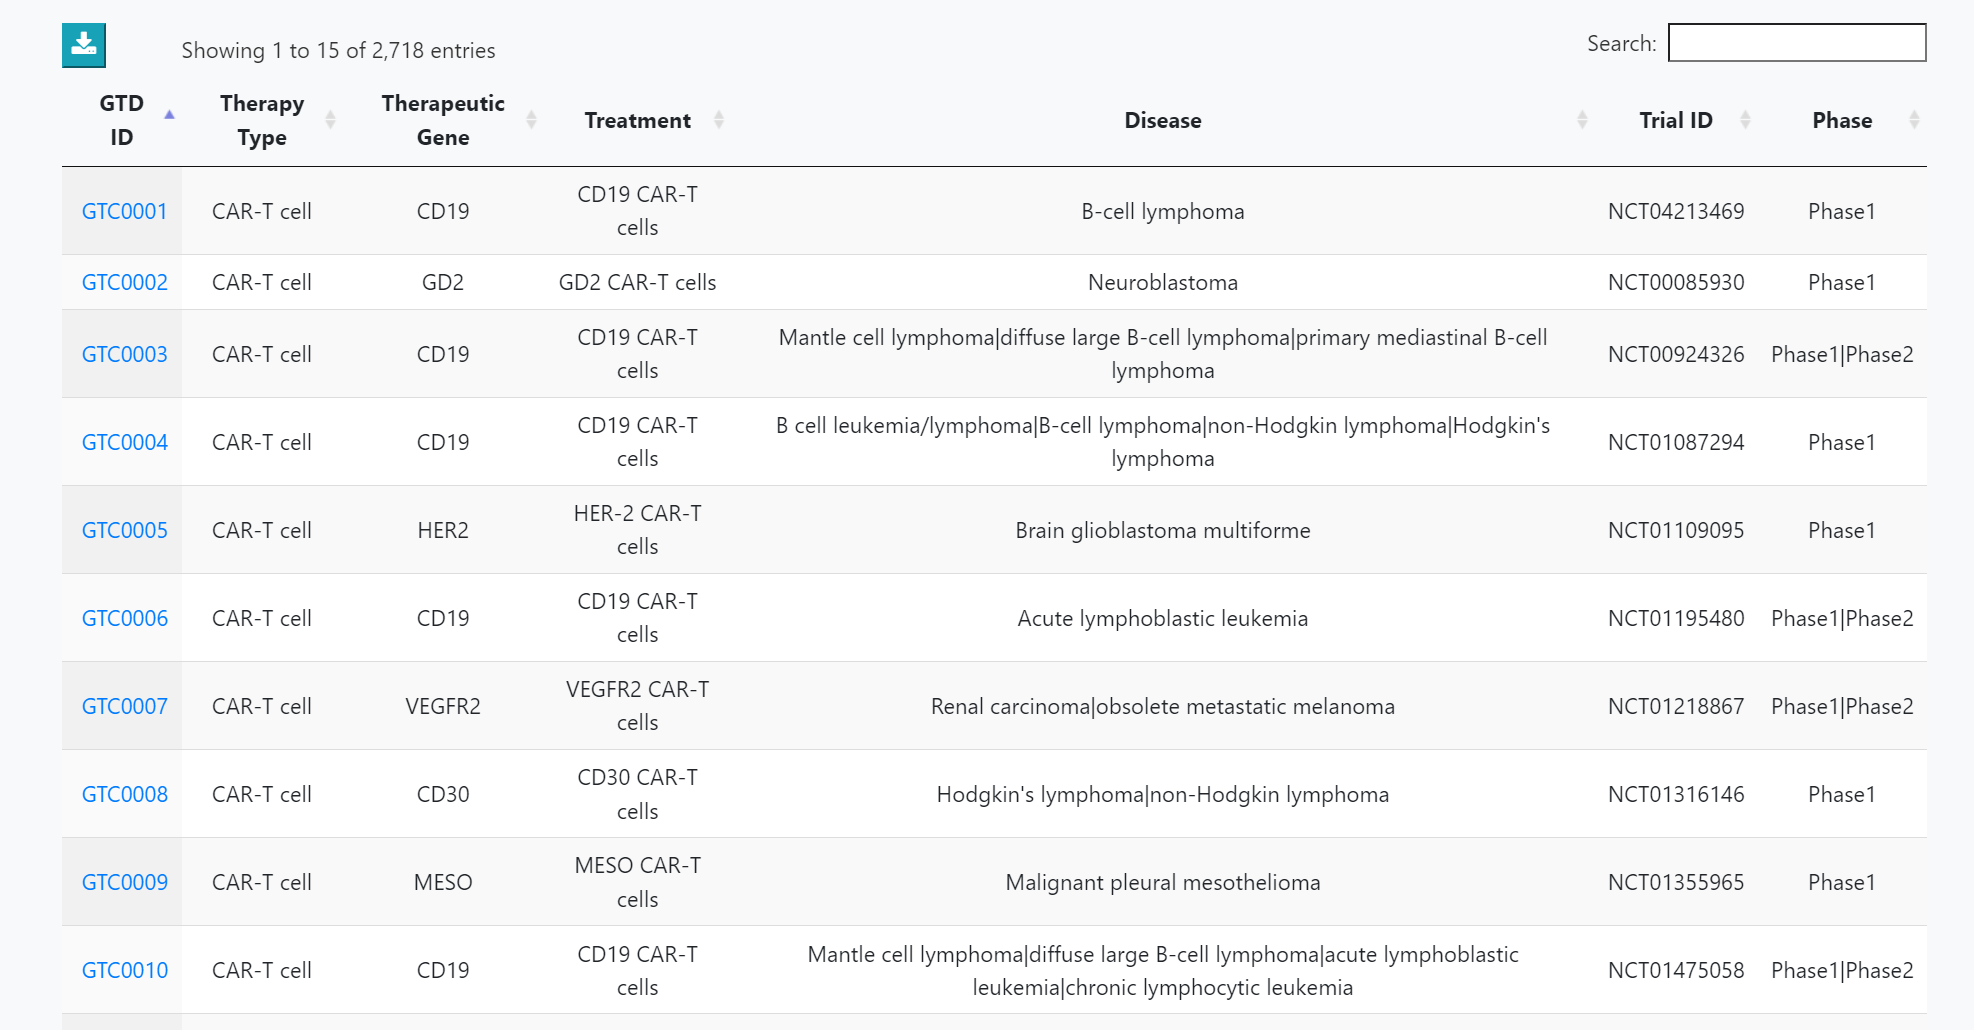
Clinical trial datasets meeting the criteria are listed. Clicking on the "GTO ID" will lead to a detailed information page.
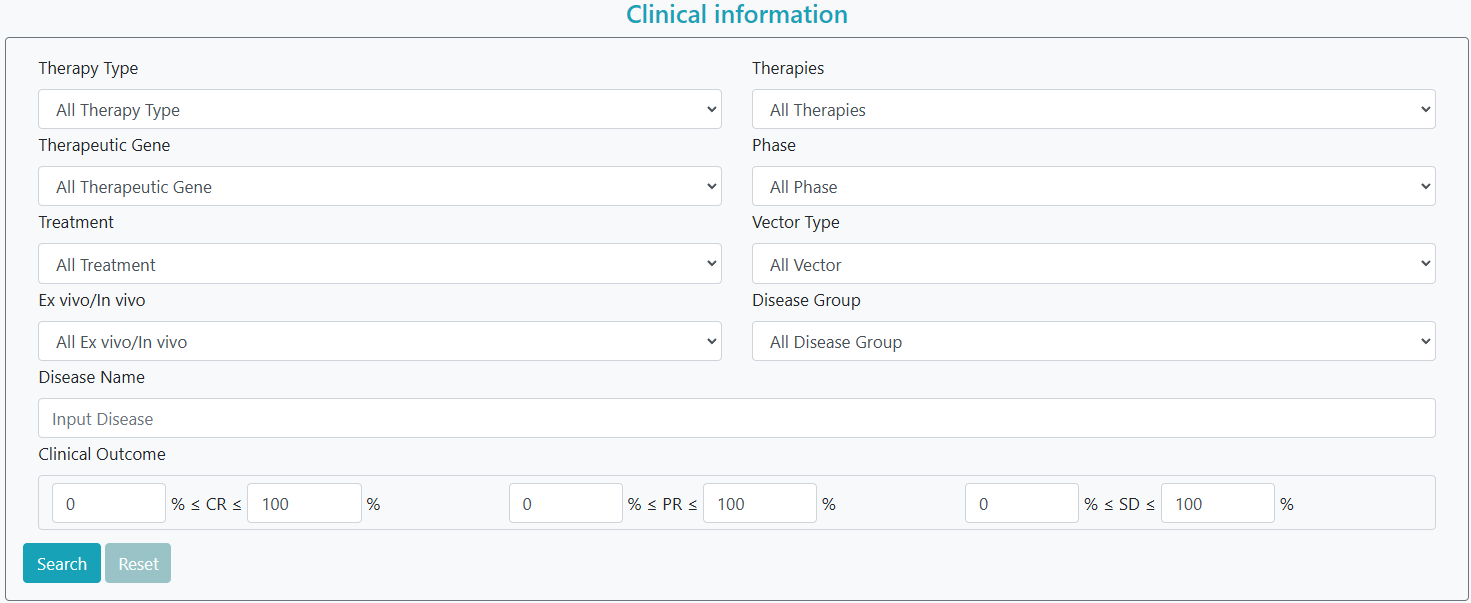
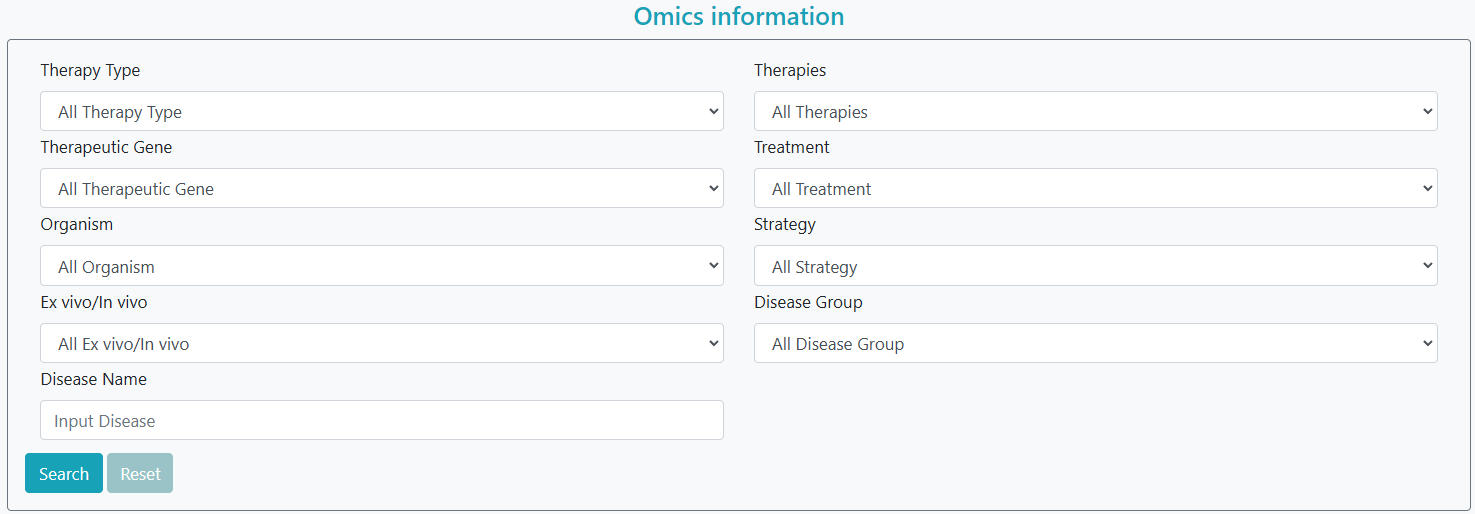
GTO offers an advanced search option on the search page. By selecting the ‘clinical information’ option, users can enter one or a series of diseases in the form and simultaneously select other characteristics (e.g., ‘therapy type’, ‘phase’, ‘altered gene’, ‘treatment’) for a more precise search. Gene therapy clinical trials that meet the criteria are then listed accordingly. Alternatively, by selecting the ‘Omics information’ option, users can filter gene therapy omics datasets according to various characteristics, including ‘therapy type’, ‘altered gene’, ‘treatment’, ‘disease name’, ‘data type’, and ‘accession’.
Step 1: Select clinical trial data or omics data.
Step 2: Filter keywords of interest.
Step 3: Click the "Search" button.
Step 4: To continue filtering, click the "Reset" button.
Detailed information page
Clinical trial data
Three parts of clinical information will be presented.
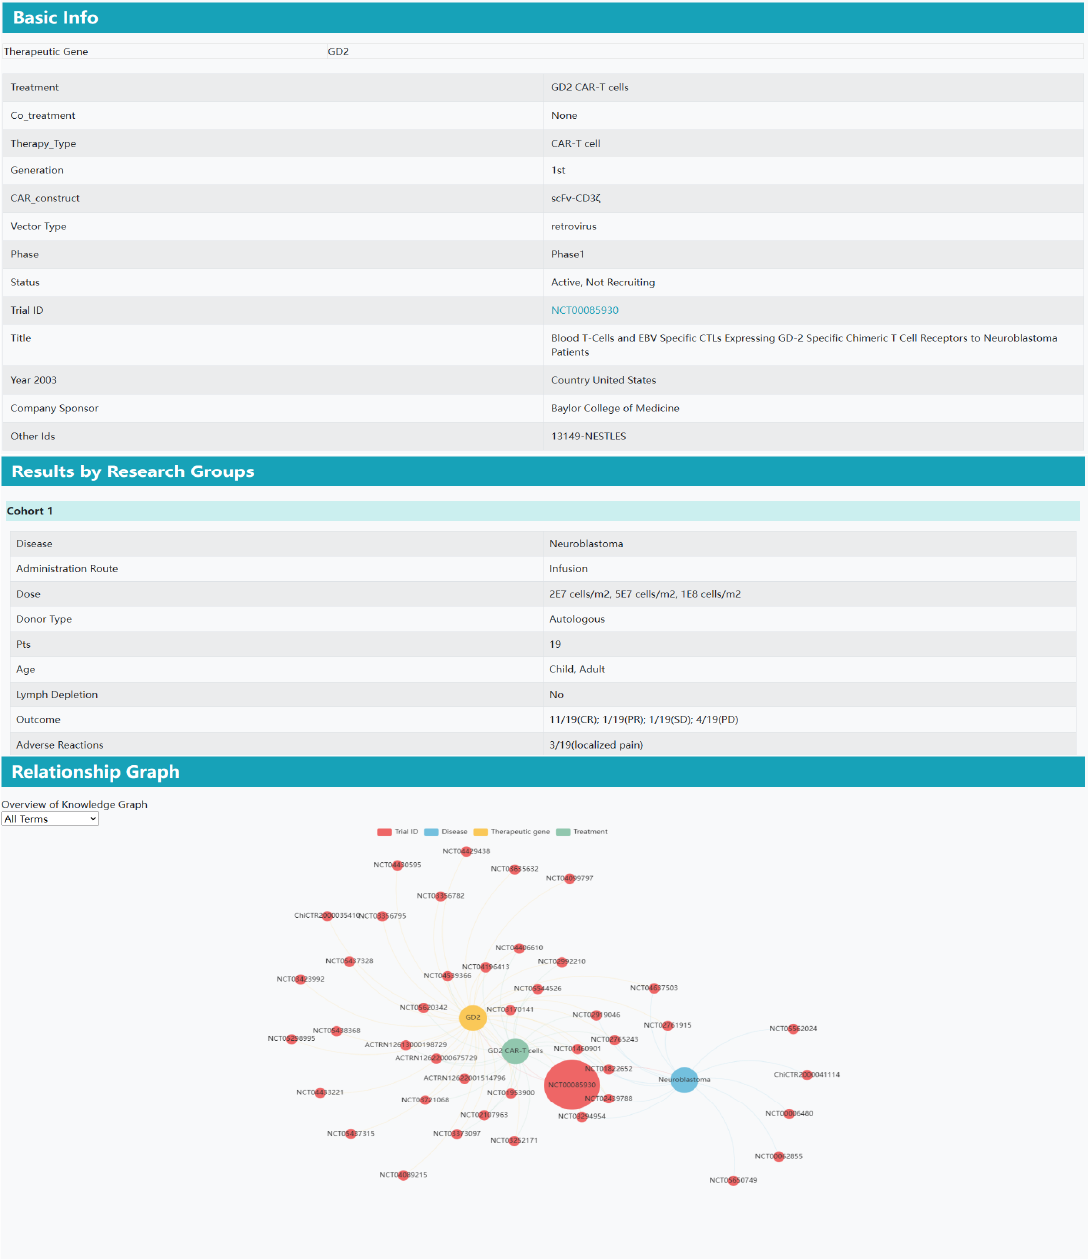
Part 1: Basic information. In the basic information section, it shows fundamental details of all groups in the clinical trial, including altered gene, treatment, co_treatment, therapy type, vector type, year, trial ID, recruitment status, phase, country, title, sponsor, and more. If some information of the clinical study is empty, the information will not be displayed.
Part 2: Results by research groups. In the grouping information section, it presents details of disease, administration route, dose, donor type, number of participants, serious adverse reactions, clinical outcomes, and others. If some information of the clinical study is empty, the information will not be displayed.
Part 3: Relationship graph. In the relationship graph section, different clinical trials are linked through the same disease, altered gene, or treatment. Clicking the clinical trial number navigates to the corresponding clinical trial information results.
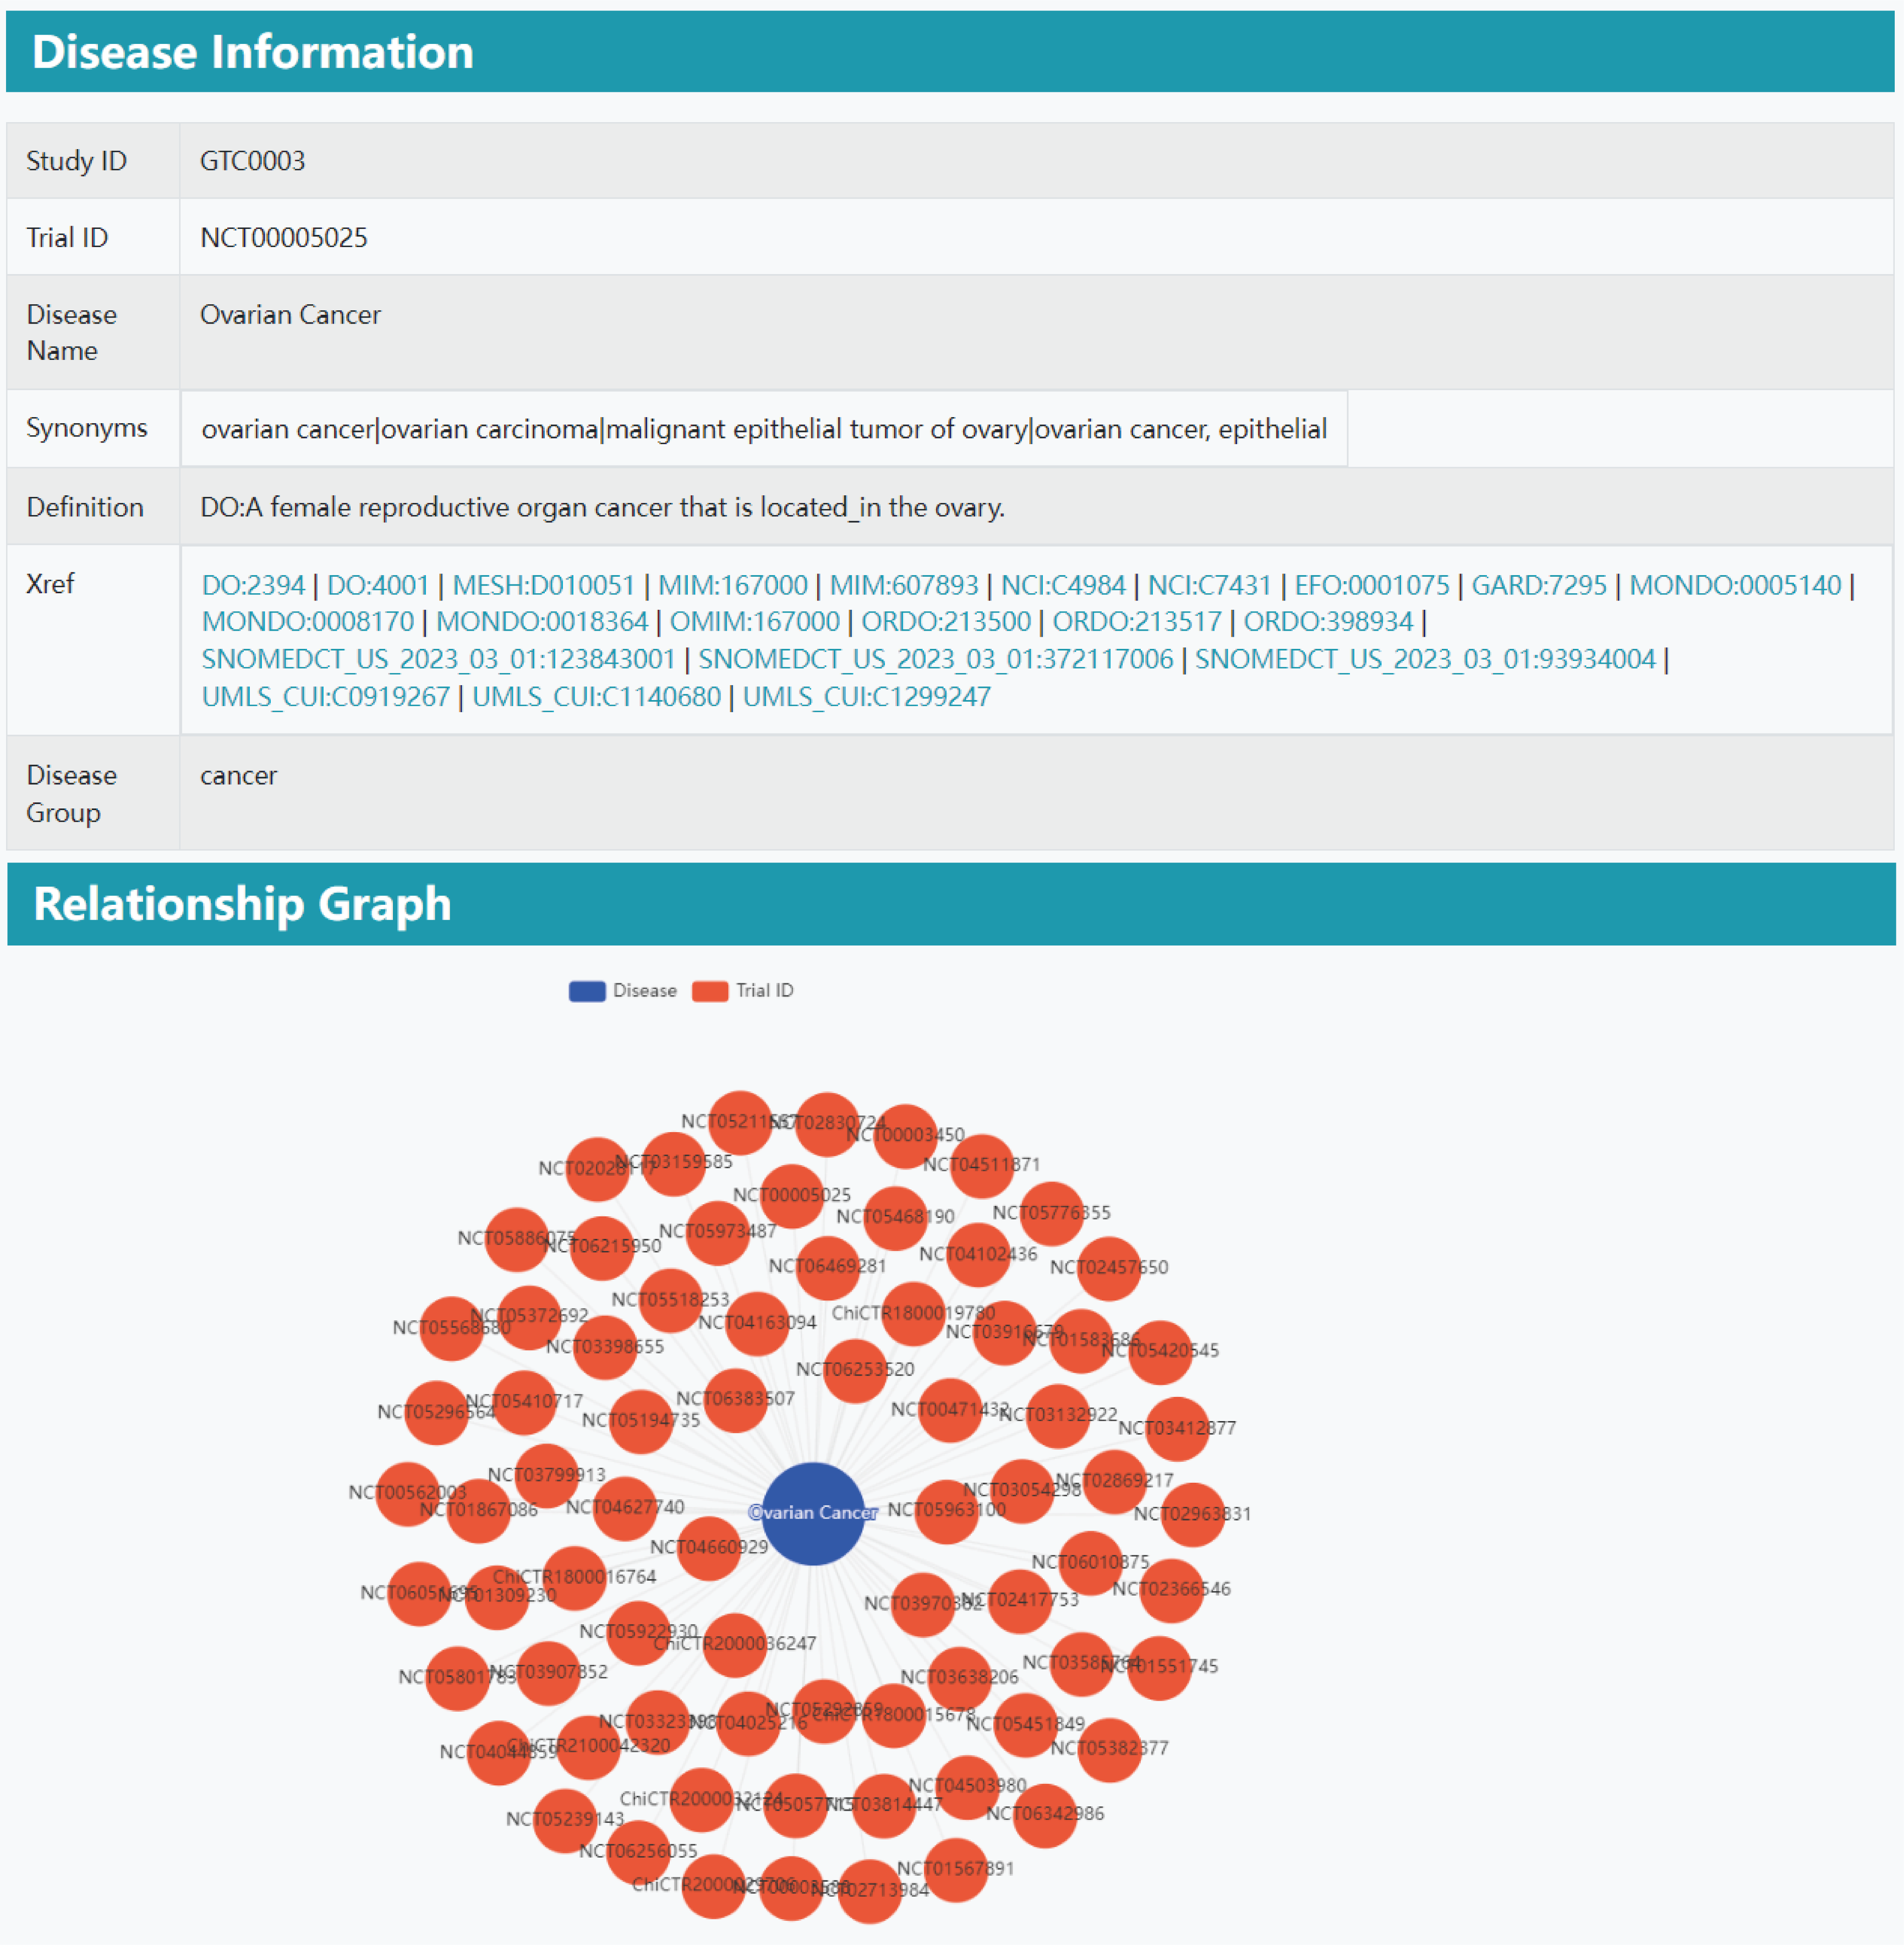
Part 4: Disease information. Clicking on the disease name will direct users to the disease information section, which presents the Study ID, Trial ID, Disease Name, Synonyms, Definition, Cross-references (Xref), and Disease Group. Additionally, a Relationship Graph is displayed at the bottom of the page.
Omics data
Four parts of omics information will be presented.
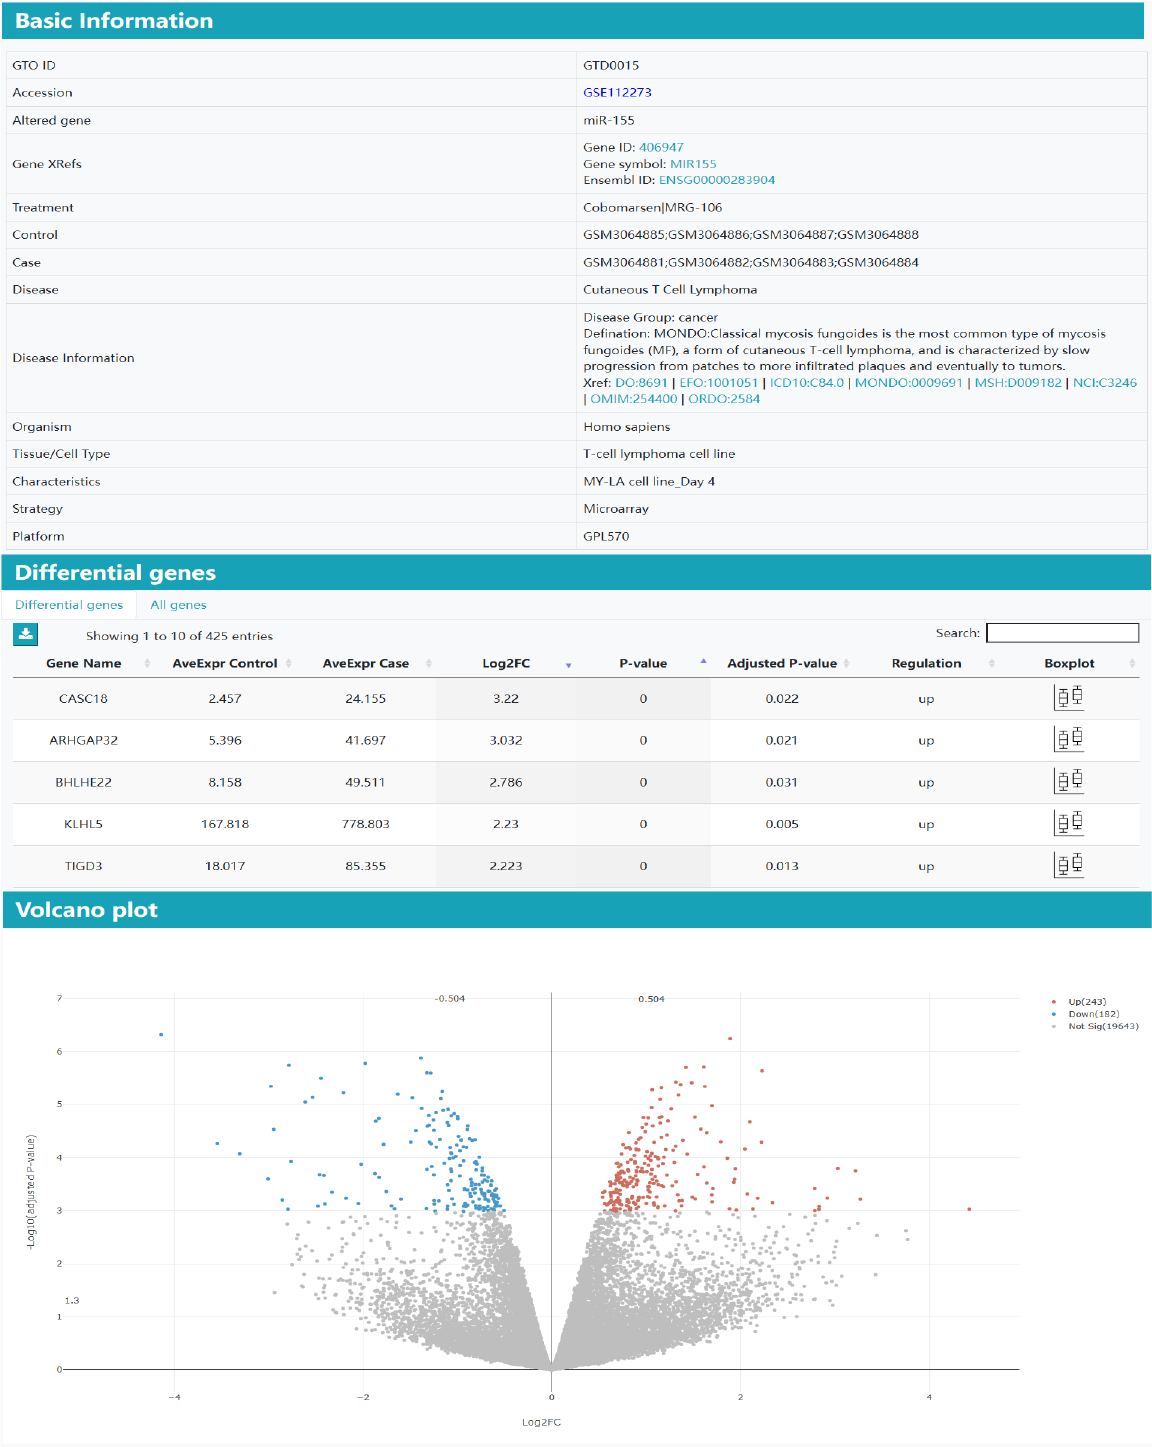
Part 1: Basic information. In the basic information section, various essential components of the gene therapy omics datasets are shown, including accession, control group, case group, disease, treatment, altered gene, organism, characteristics, strategy, platform, and more. If some information of the clinical study is empty, the information will not be displayed.
Part 2: Differentially genes. It lists DEGs induced by gene therapy in a table, accompanied by visualizations such as volcano plots, heatmaps, and boxplots.
Part 3: Enrich regulations/functions/pathways. It includes upstream and downstream enrichment of differential genes. The upstream part is the enrichment result of transcription factors between humans and mice, and the downstream part includes the enrichment results of GO, KEGG, and GSEA.
Part 4: Differential cell type markers. Only cell type marker of human and mice.
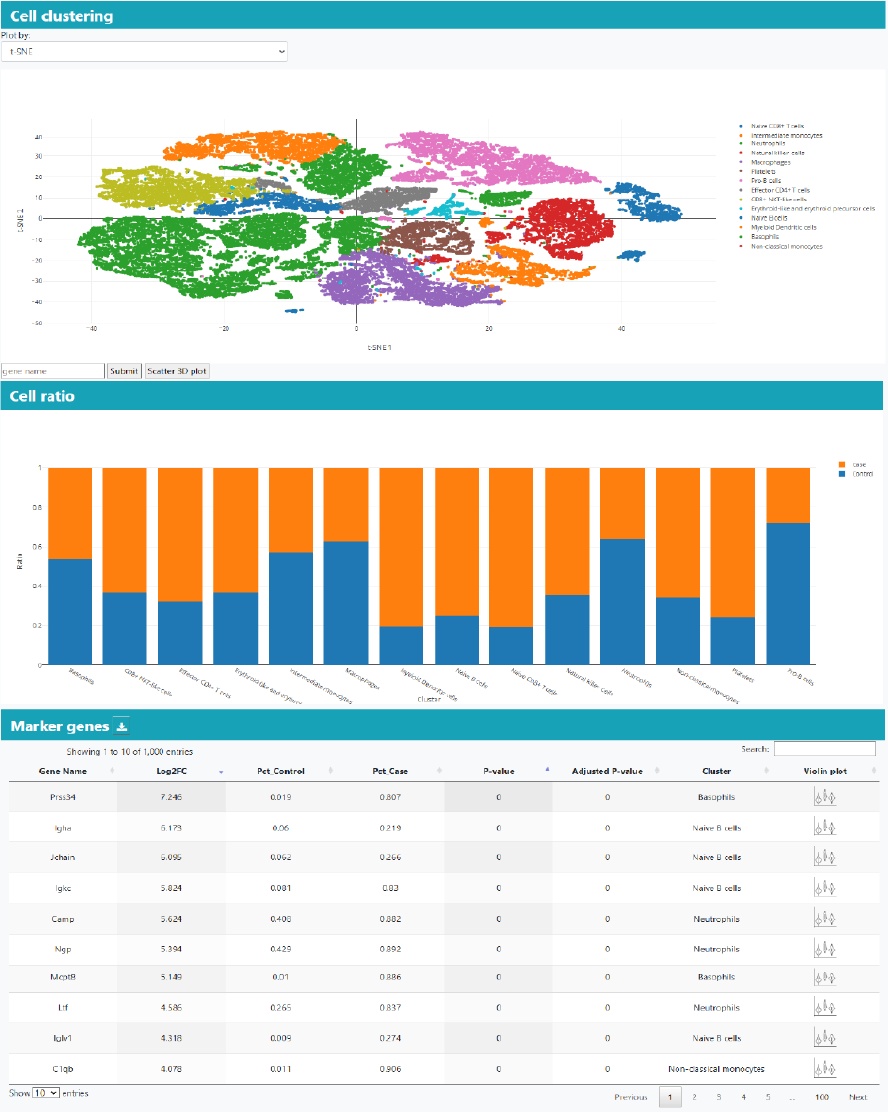
Besides the overall analysis, the single-cell cluster analysis will generate the cell clustering plot with cell type annotation when available, cluster marker genes, and differential genes in clusters.
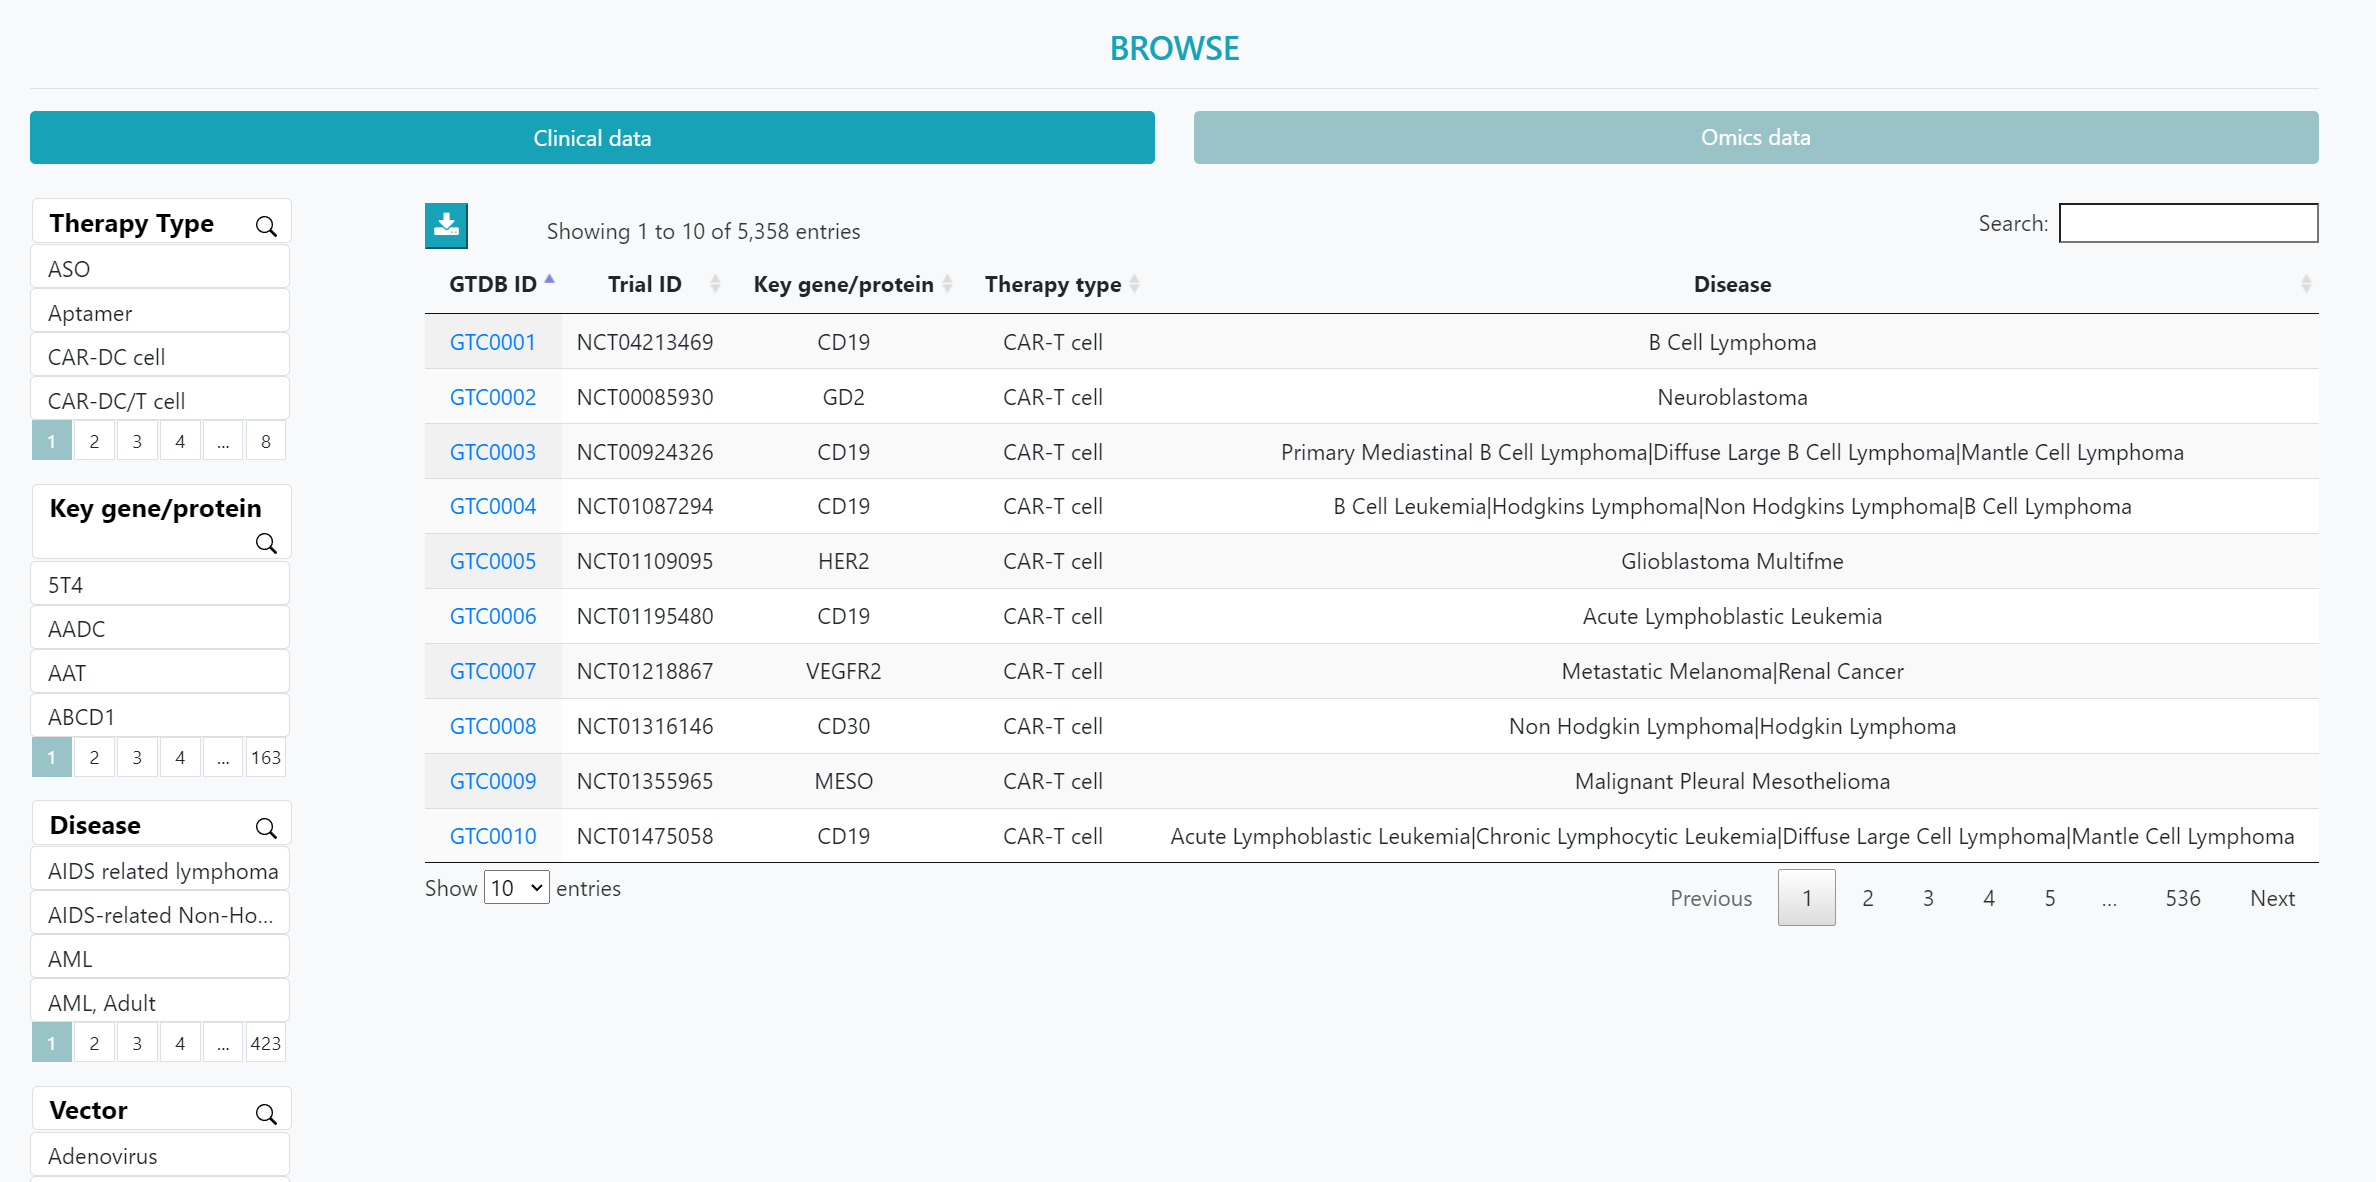
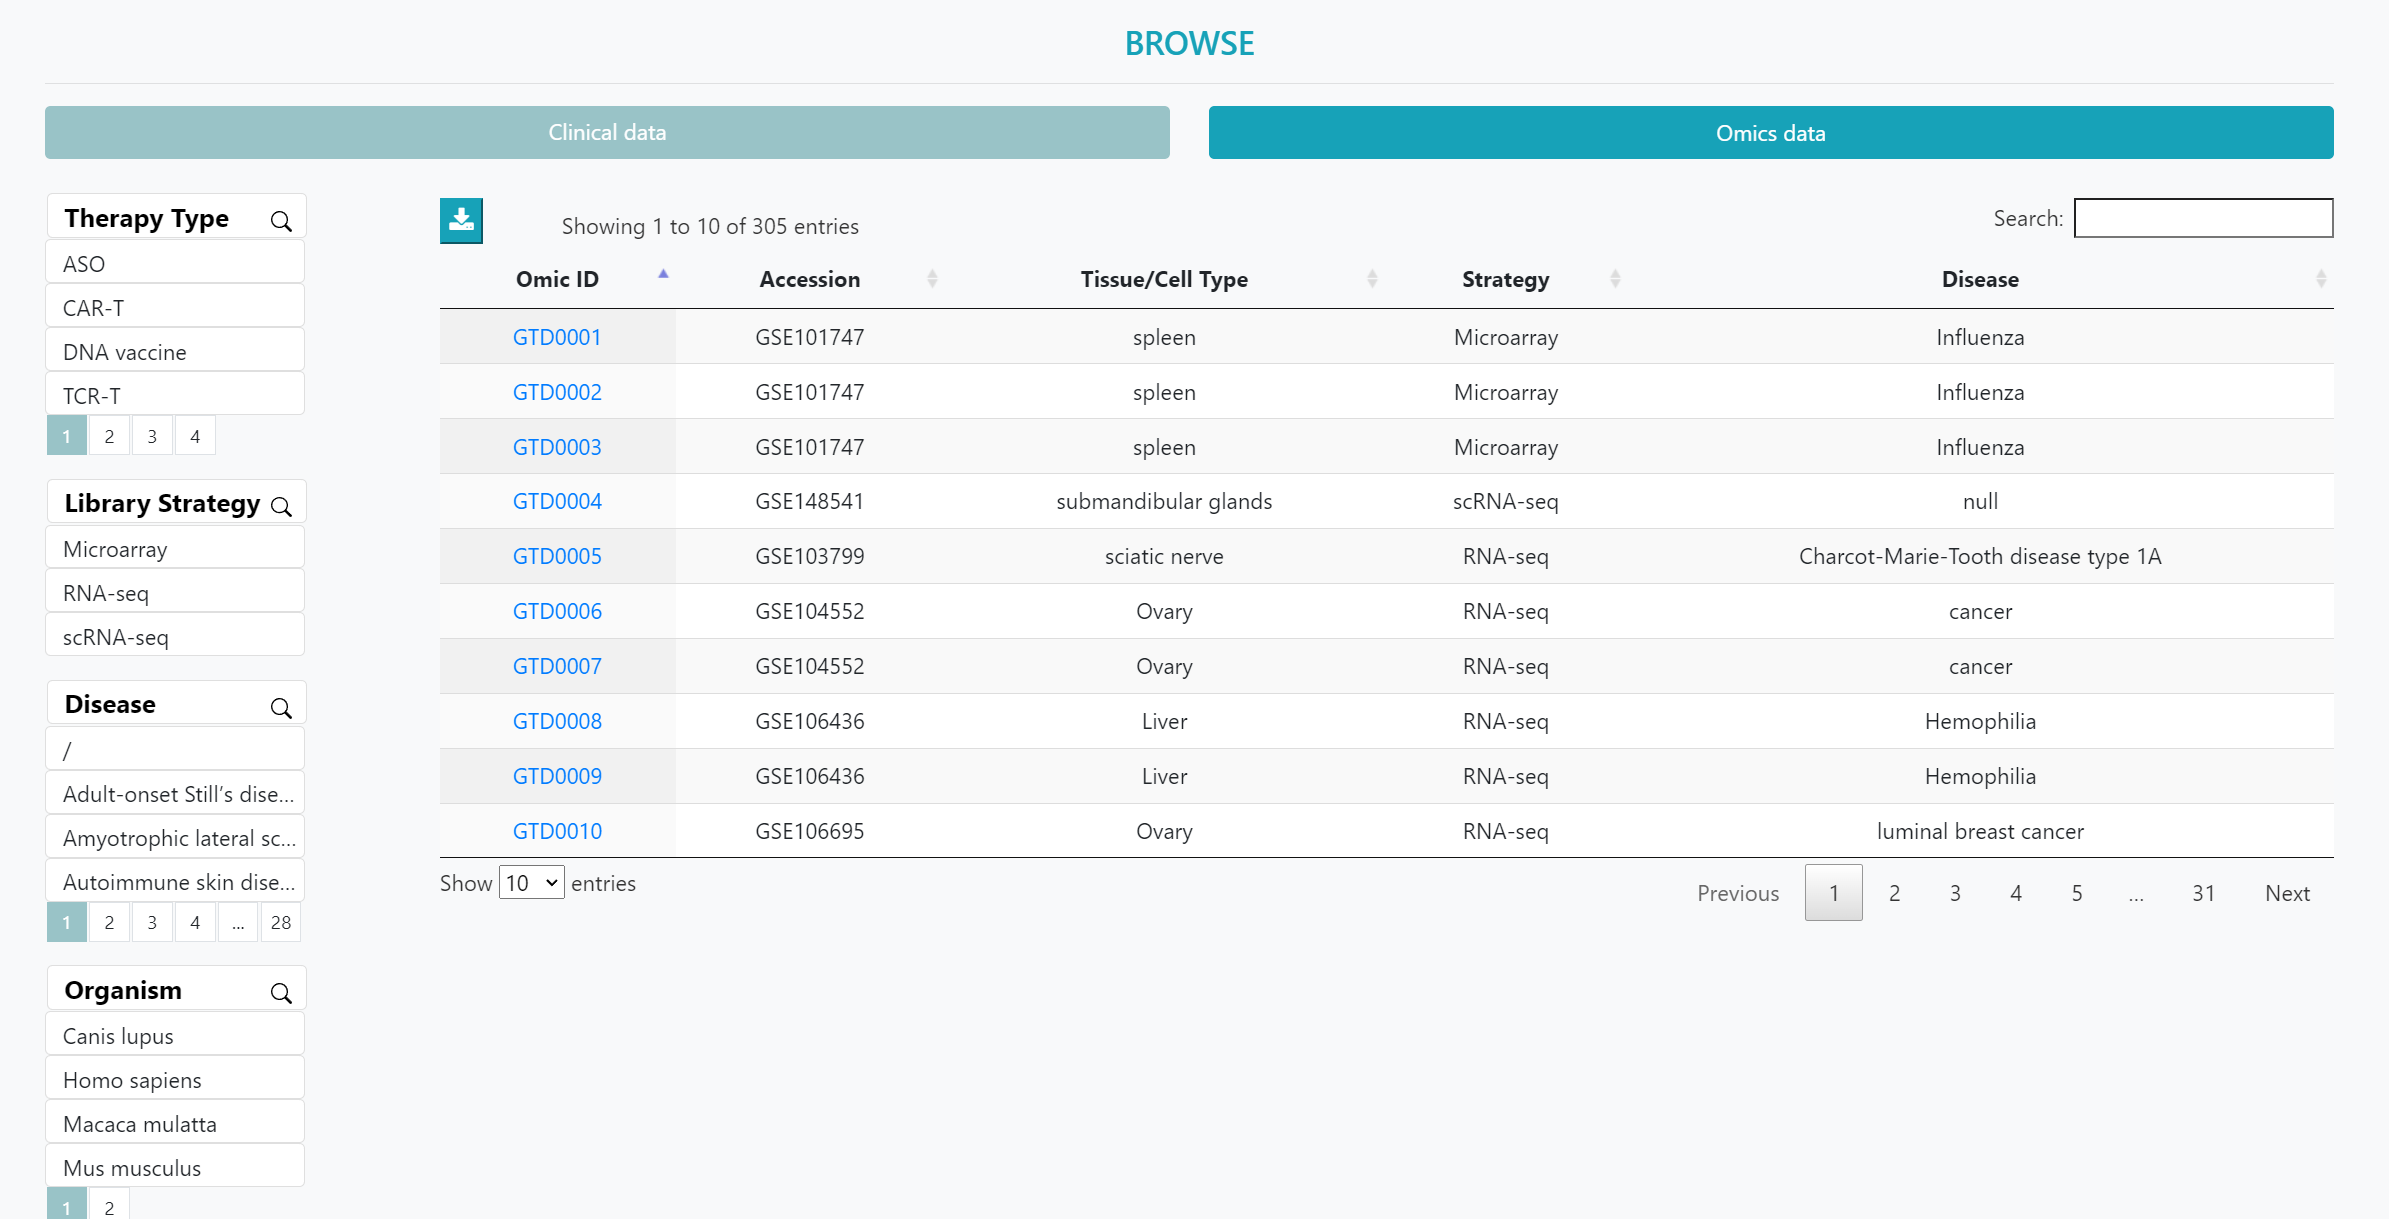
On the ‘BROWSE’ page, users can choose between clinical trial data and transcriptomics data to obtain an overview. Clicking on the "GTO ID" will lead to a detailed information page.
Additionally, users can utilize the left-hand side filters such as "Therapy Type", "Altered Gene", "Disease", and "Vector" to autonomously filter the clinical trial data of interest. For omics data, users can use filters such as ‘therapy type’, ‘strategy’, ‘disease’, and ‘organism’ to refine their selection.
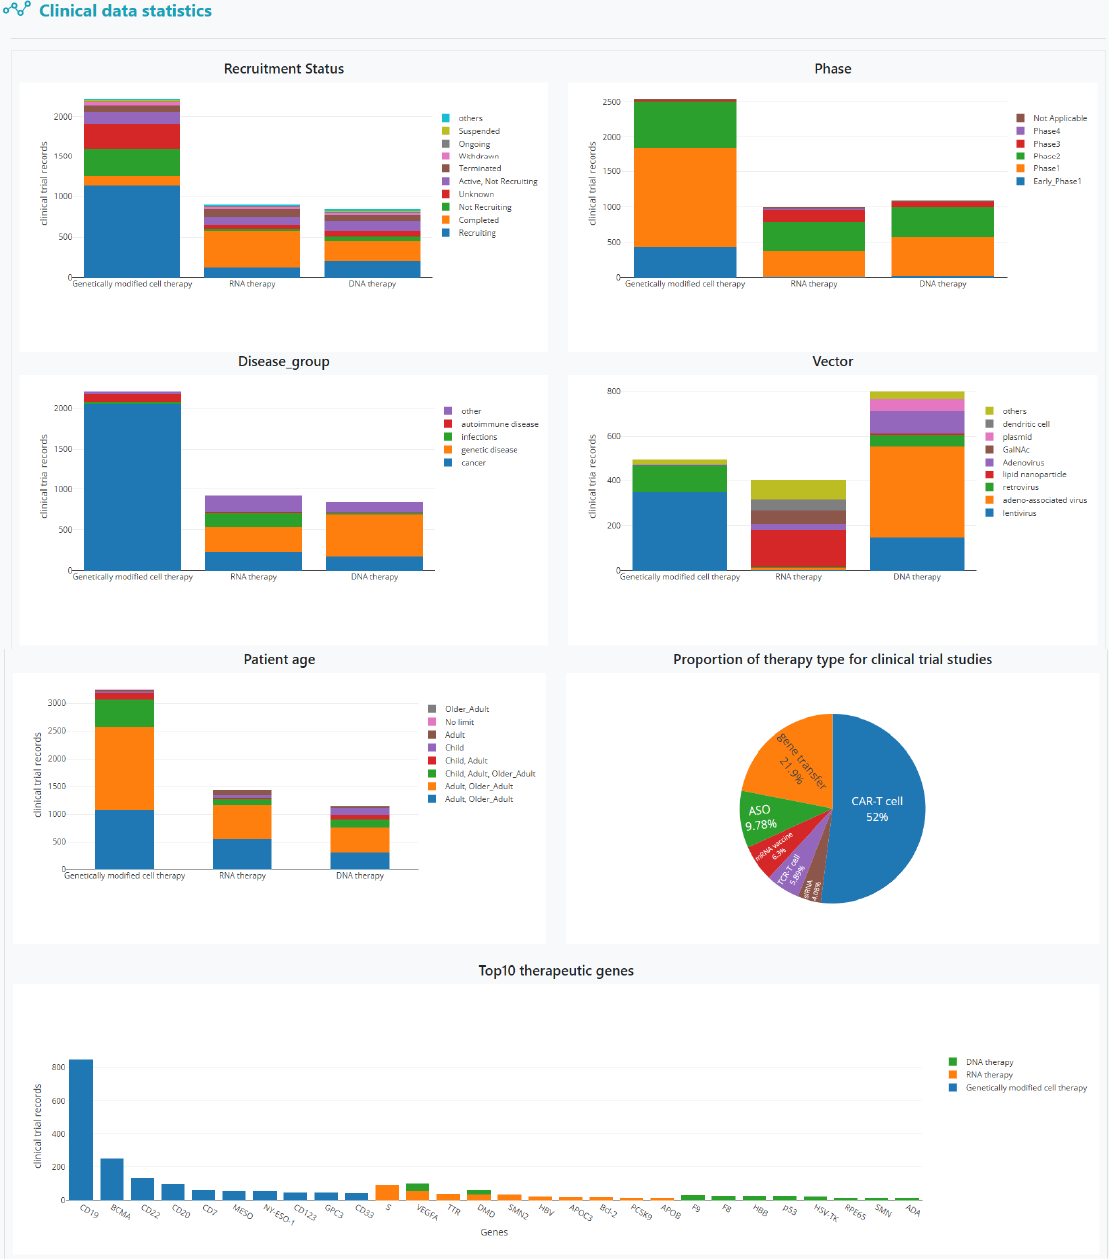
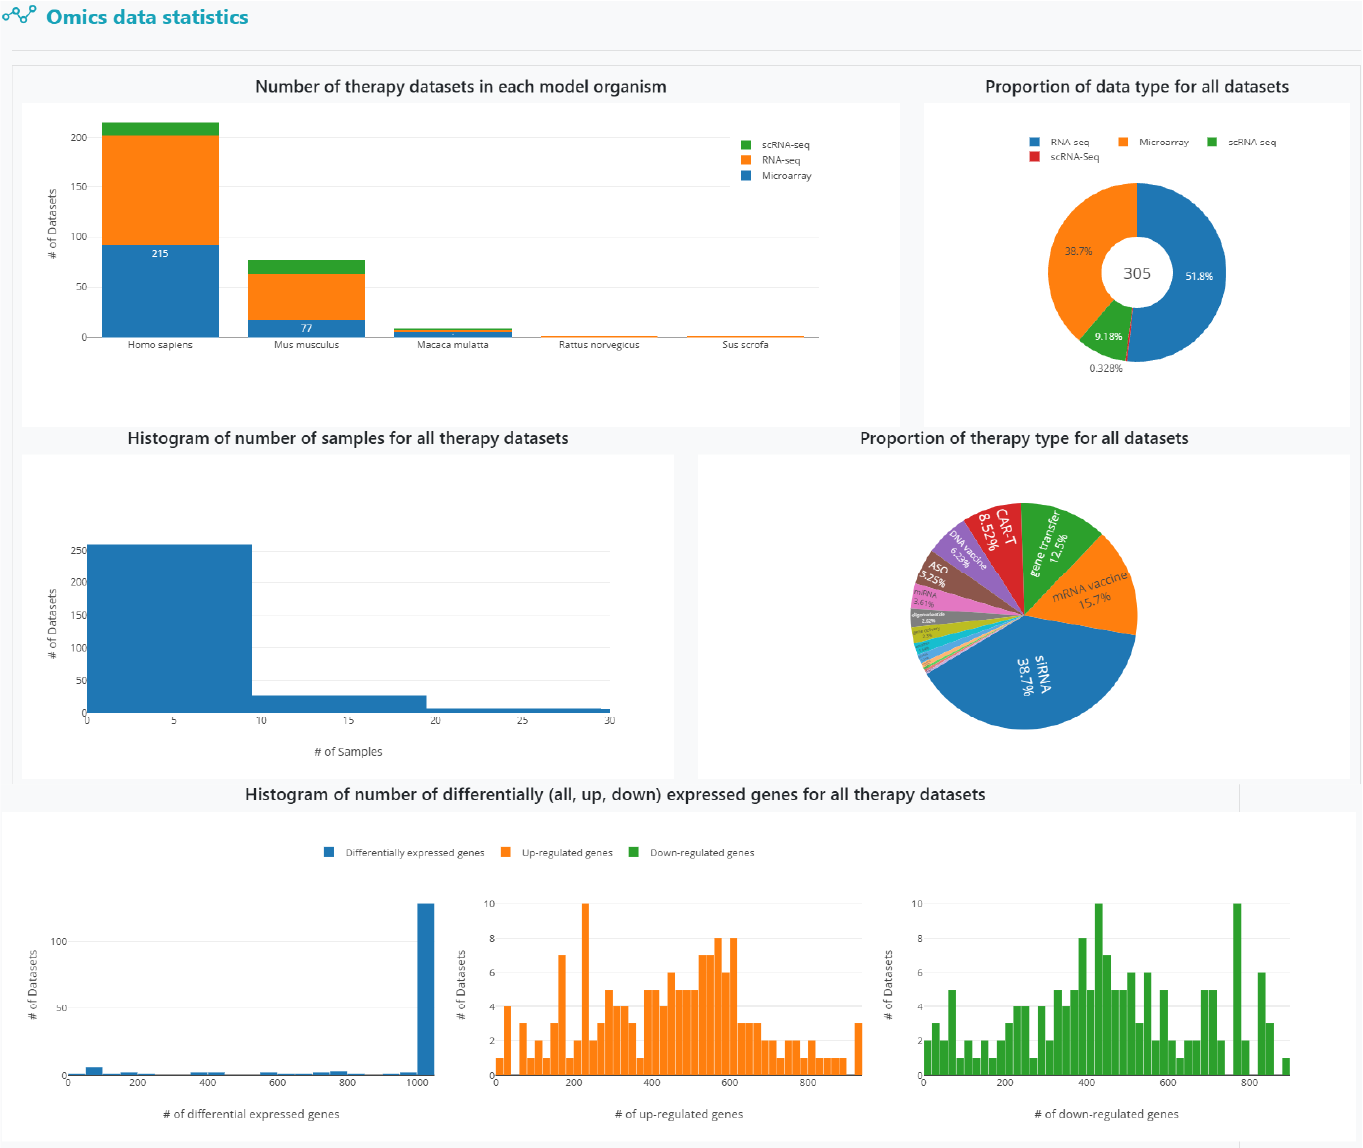
The statistics page displays detailed statistical results derived from the clinical and omics data.
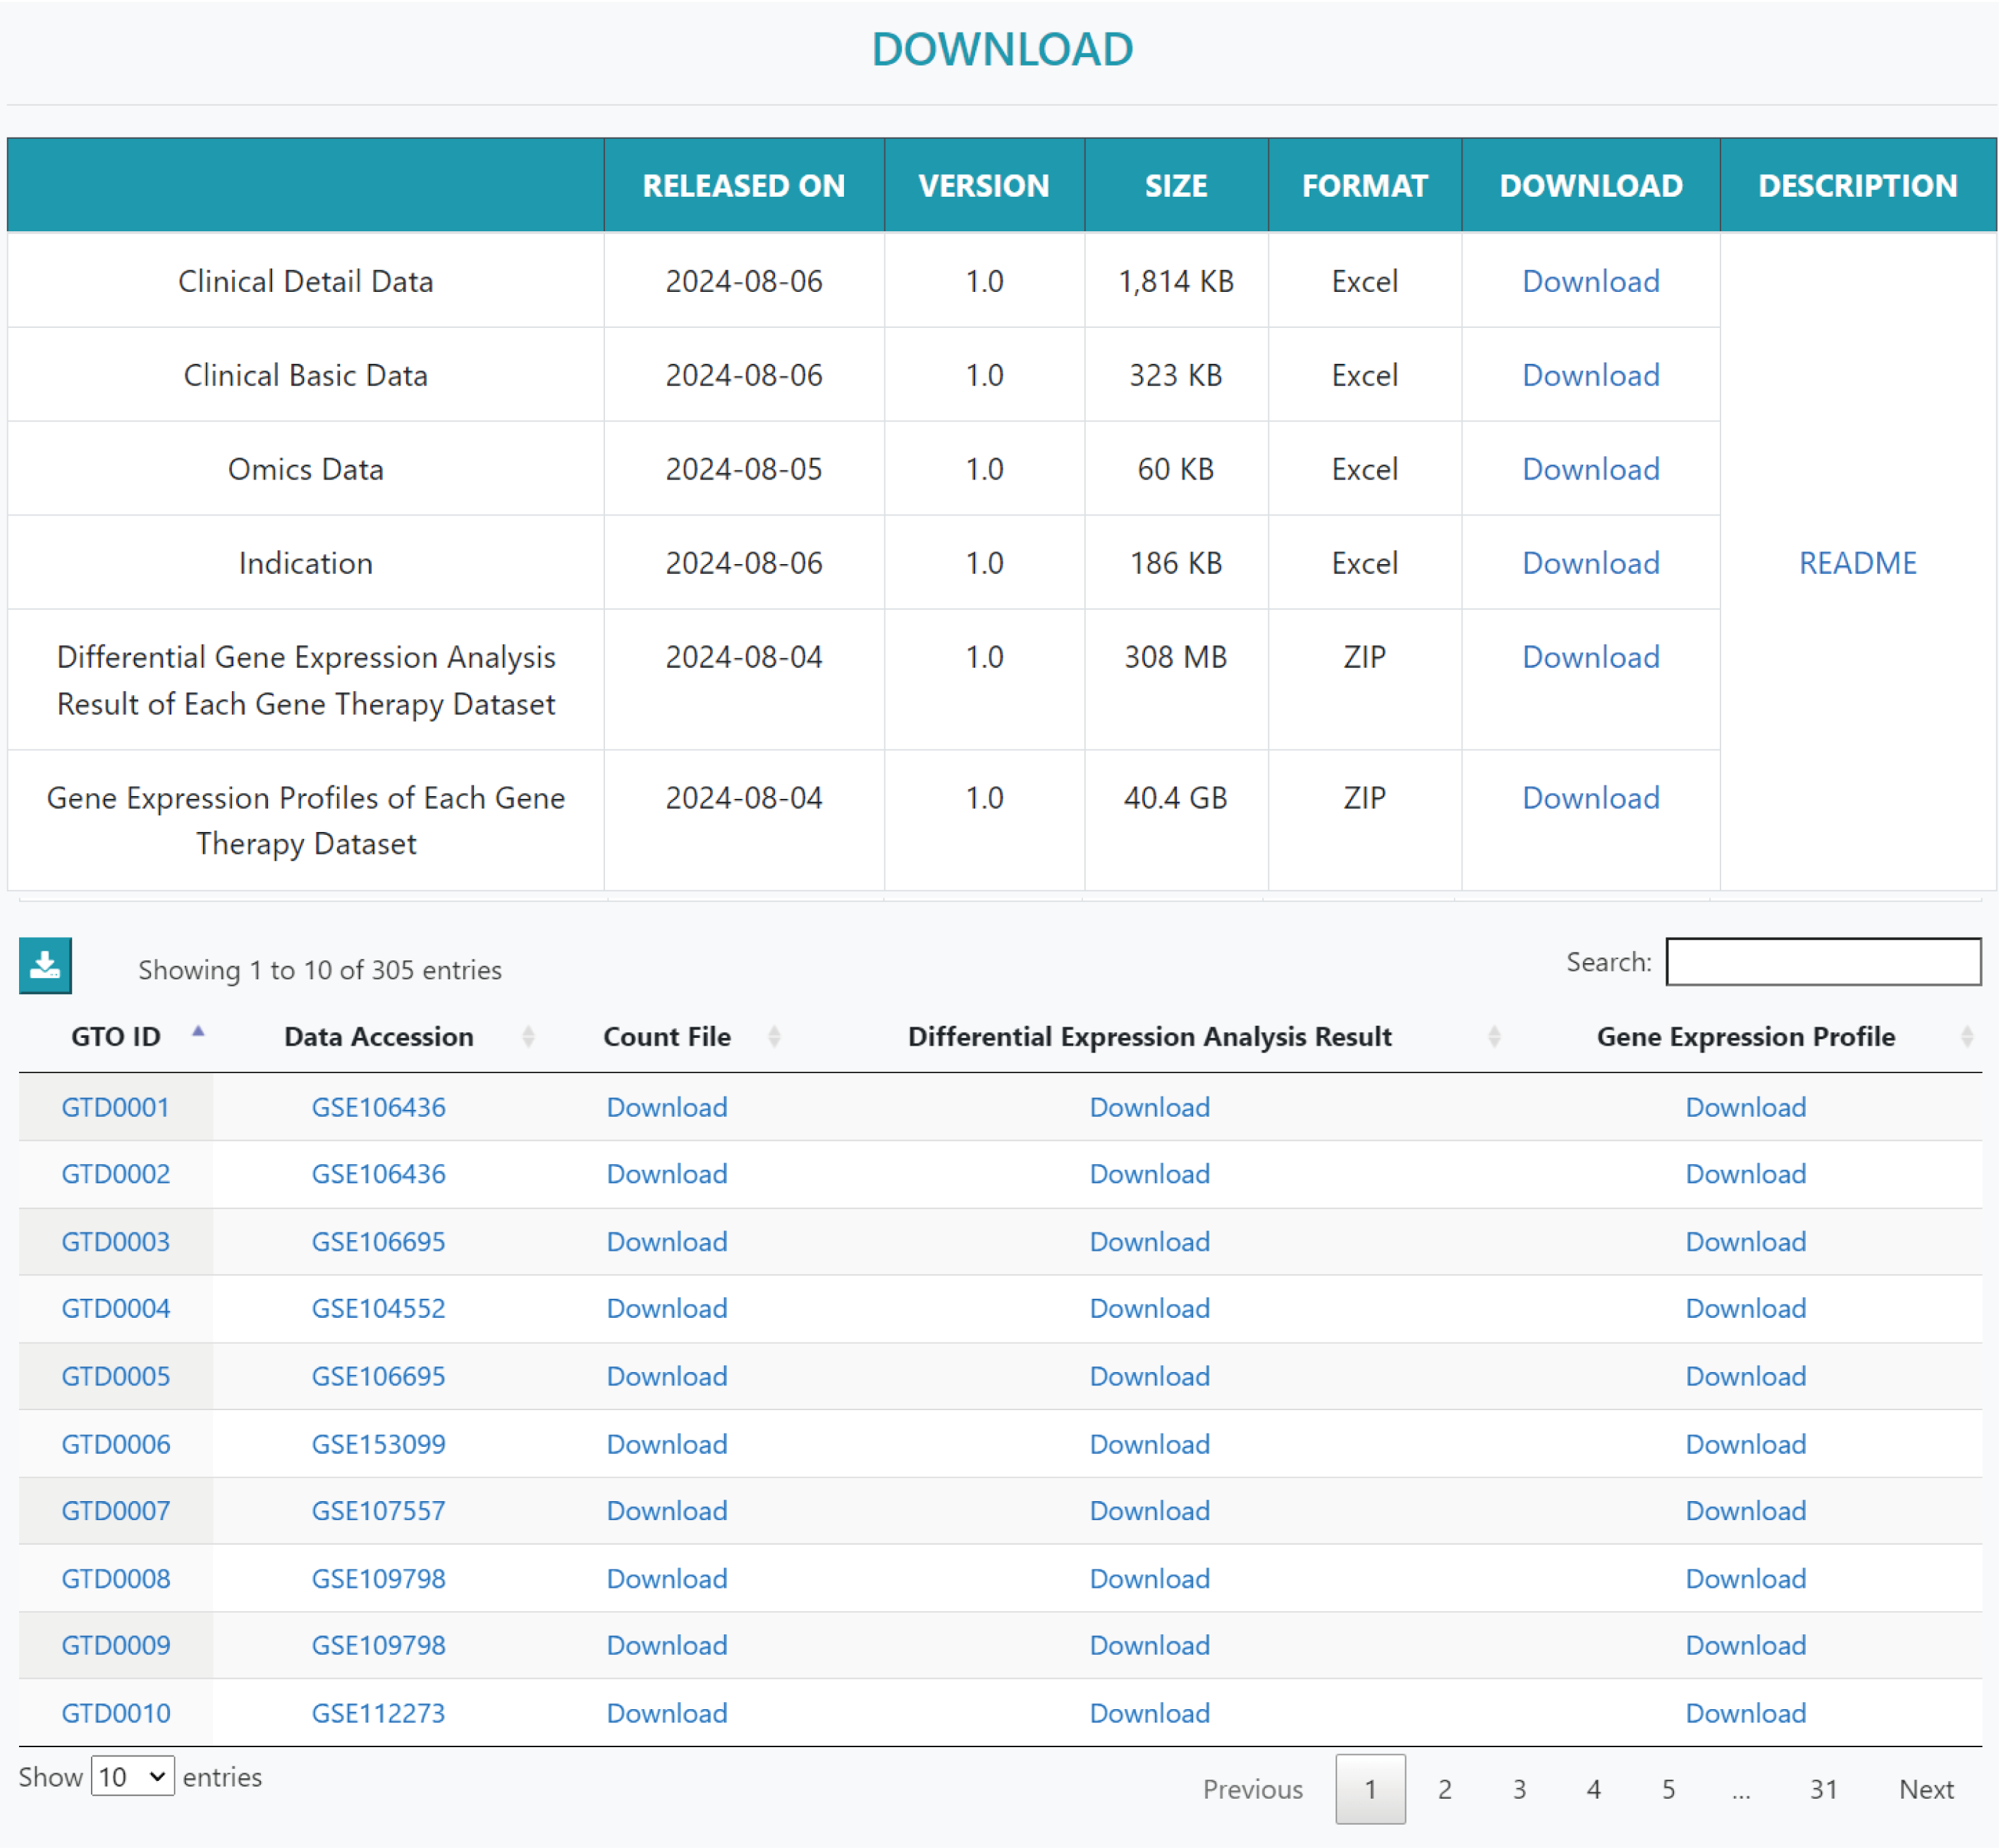
On the "DOWNLOAD" page, users can download information about gene therapy datasets, available differentially expressed genes (DEGs), results of differential gene expression analysis, and gene expression profiles for each dataset.
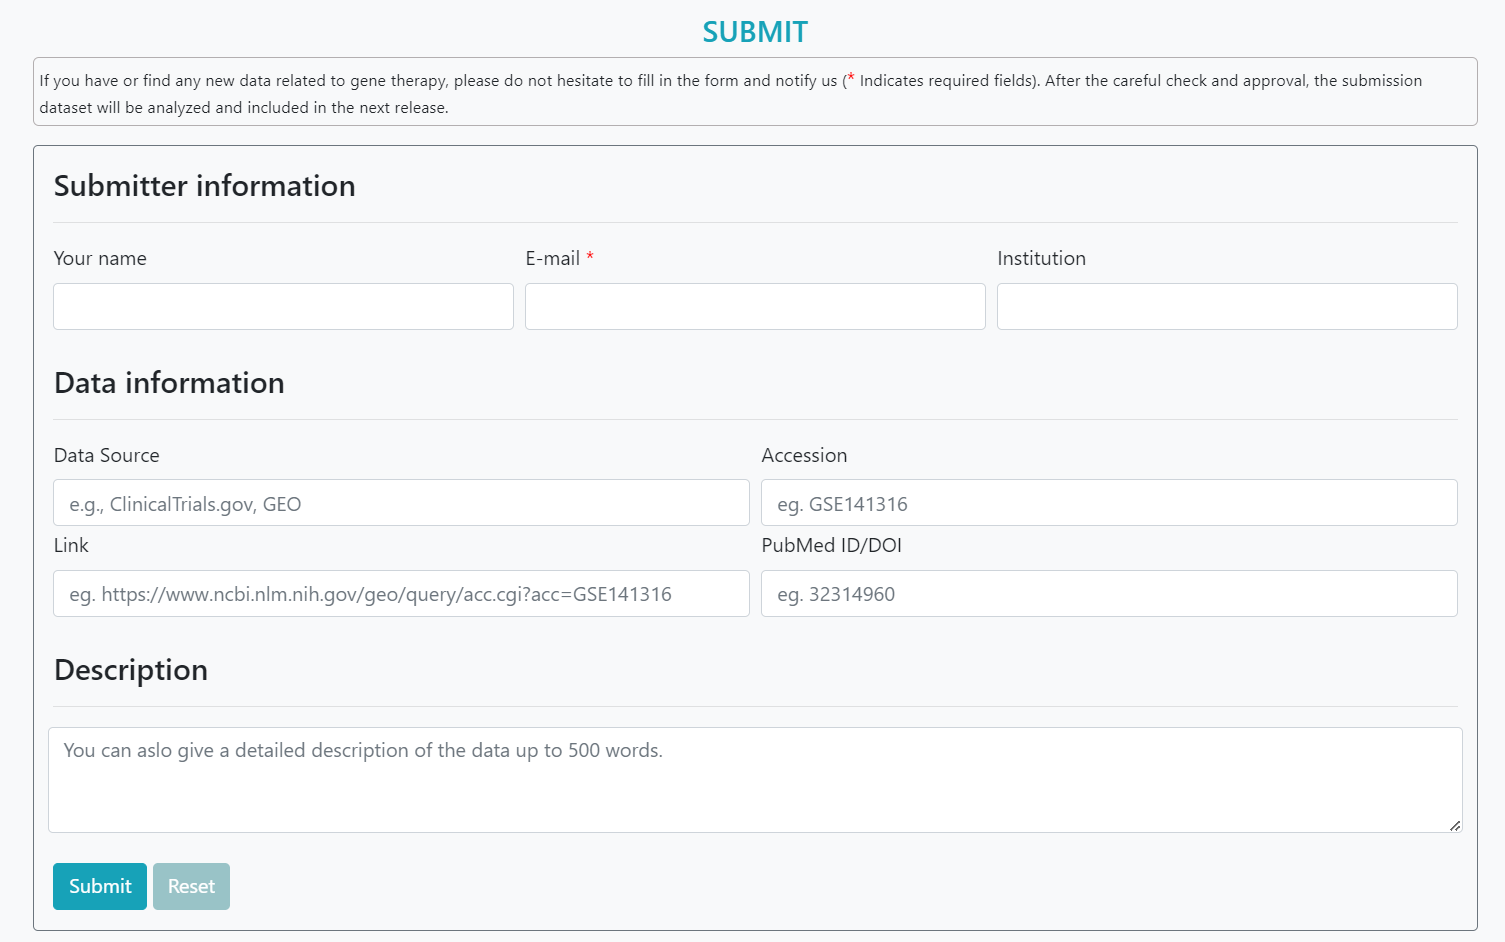
On the "SUBMIT" page, users can submit new data related to gene therapy.
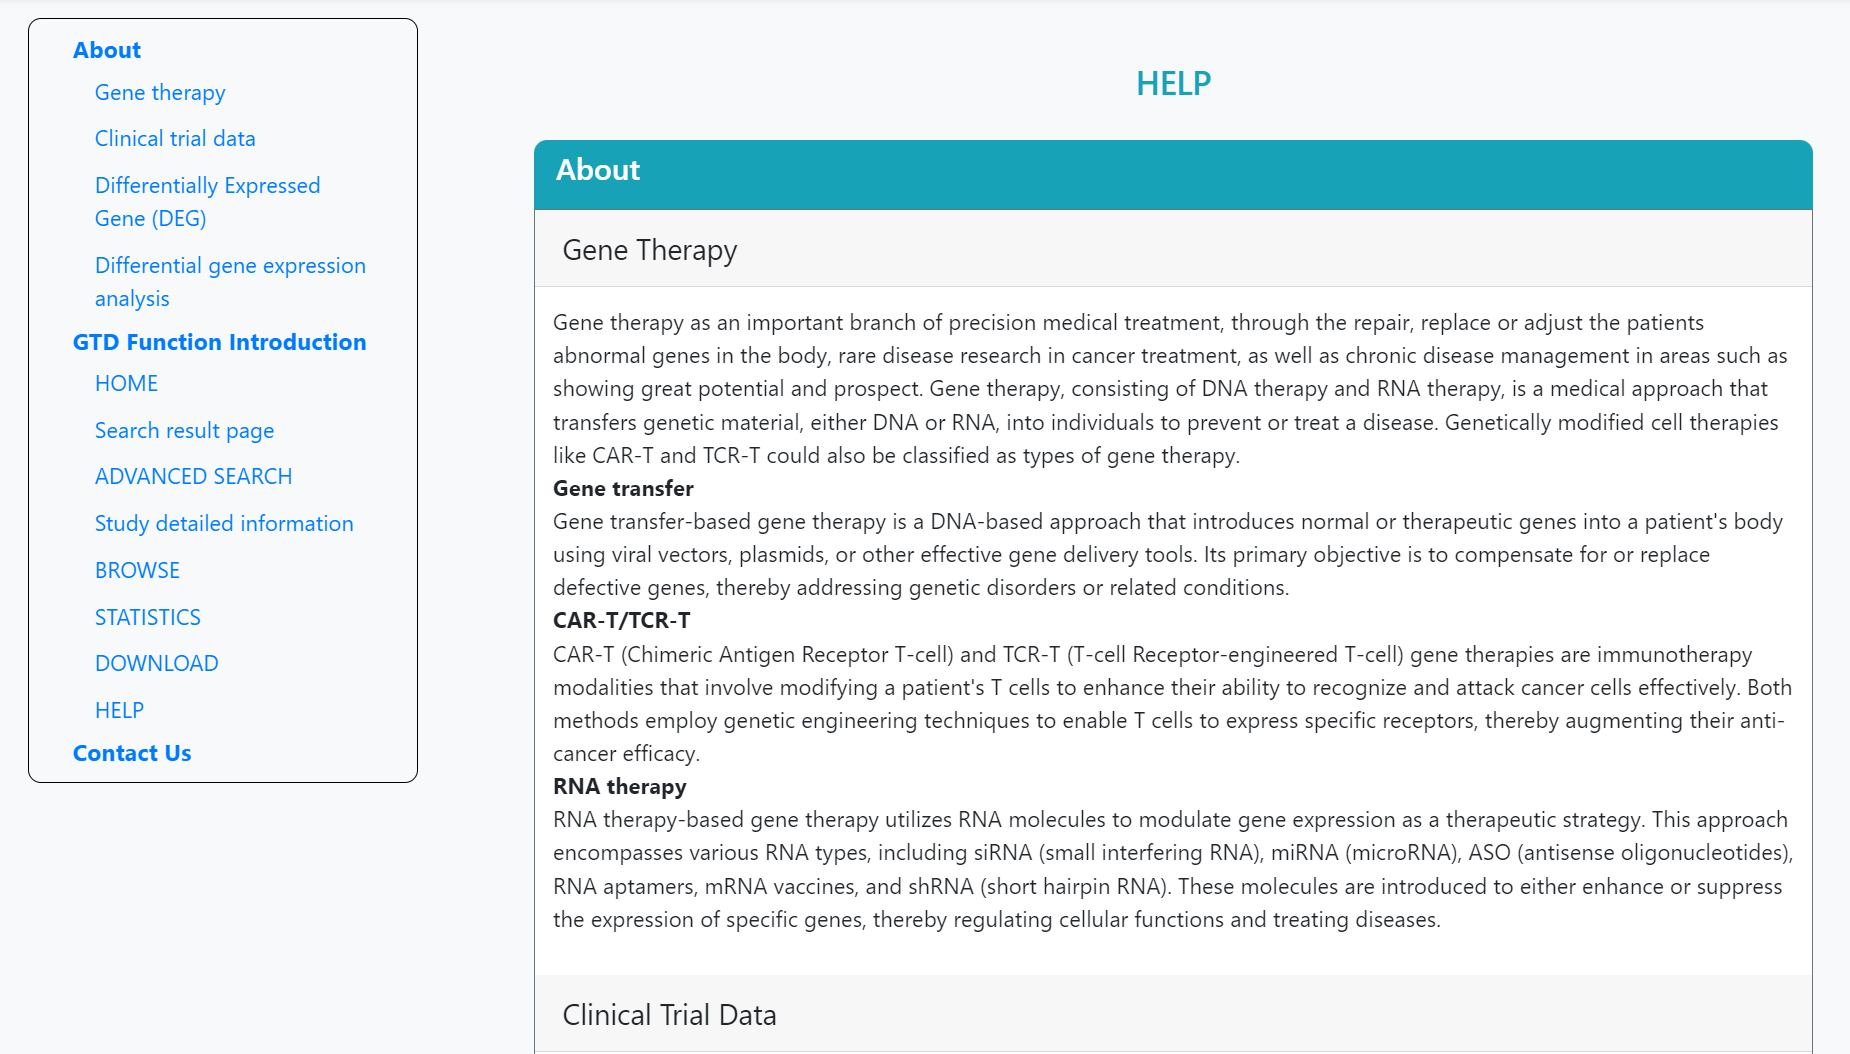
On the "HELP" page, the introduction of the features and the guidelines for the functions are stated. The contact details are attached at the bottom.
- Please feel free to contact Prof. Jianbo Pan with respect to any details pertaining to GTO.
-
>Address :
Basic Medicine Research and Innovation Center for Novel Target and Therapeutic Intervention, Ministry of Education, College of Pharmacy, Chongqing Medical University.
No. 1 Yixueyuan Road, Yuzhong District, Chongqing, 400016, P. R. China.
-
>Email :
panjianbo@cqmu.edu.cn